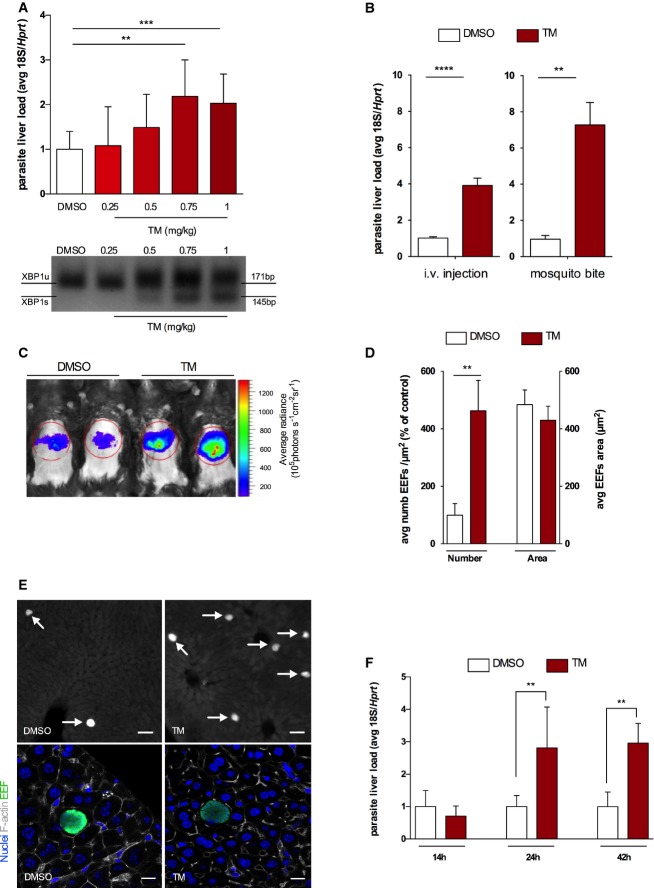
Figure 2.
UPR activation increases EEF numbers in the liver
- Upper panel: P. berghei liver load quantification on mice treated with DMSO (control) or different tunicamycin (TM) doses 8 h prior to sporozoite injection. qRT–PCR of Plasmodium berghei 18S ribosomal RNA at 42 h after sporozoite infection normalized to hypoxanthine-guanine phosphoribosyltransferase (Hprt) expression. ***P < 0.001 and **P < 0.01, t-test. Results are expressed as means ± SD (n = 5 mice per group, two independent experiments) and TM expressed as fold change compared to DMSO. Lower panel: PCR analysis of XBP1 maturation in infected mouse livers previously treated with DMSO and TM. XBP1 unspliced (U) and spliced (S) mRNA species were resolved by high-density agarose gel (3%) (image representative of two independent experiments with n = 5 mice per group).
- Plasmodium berghei liver load quantification on mice treated with DMSO or TM 8 h prior to sporozoite delivery by either i.v. injection or mosquito bite. qRT–PCR of parasite 18S ribosomal RNA at 42 h after sporozoite infection normalized to Hprt expression. ****P < 0.0001 and **P < 0.01, t-test. Results are expressed as means ± SD (n = 5 mice per group, six independent experiments, for i.v. injection; n = 5 mice per group, three independent experiments for mosquito bite) and TM expressed as fold change compared to DMSO.
- Luciferase-expressing P. berghei infection load on DMSO and TM-treated mice at 42 h after infection (image representative of 3 independent experiments).
- Fluorescent microscopy quantification of EEF density (number) and size (area) on DMSO and TM liver sections at 42 h after P. berghei sporozoite injection. **P < 0.01, t-test. Results are expressed as means ± SD (n = 4 mice per group, three independent experiments).
- Representative fluorescence images of liver sections of DMSO- and TM-treated mice, 42 h after infection with GFP-expressing P. berghei sporozoites; arrows indicate parasite EEFs, left scale bars 50 μm; parasite in green, DNA stained with Hoechst (blue); and F-actin with phalloidin Alexa 555 (white), right scale bars 11 μm.
- Plasmodium berghei liver load quantification at 14, 24 and 42 h after i.v. sporozoite injection on mice treated with DMSO and TM for 8 h. Infection measured by qRT–PCR of parasite 18S ribosomal RNA normalized to Hprt. **P < 0.01, t-test. Results are expressed as means ± SD (n = 4 mice per group, two independent experiments).

