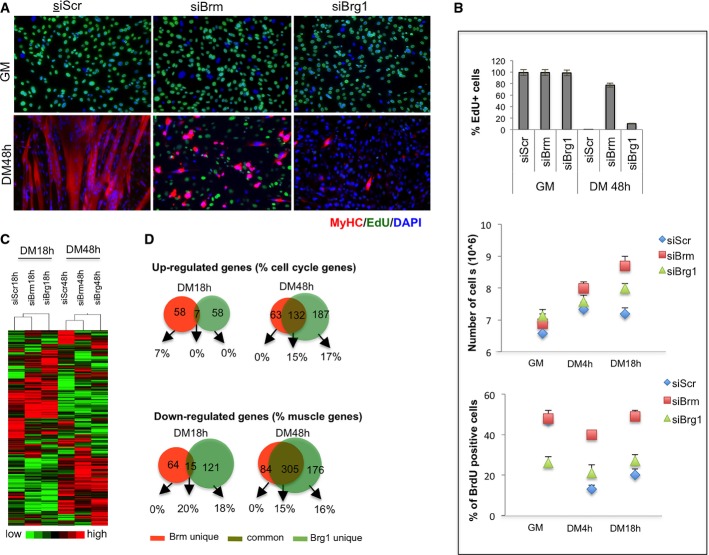
Figure 2.
Downregulation of Brm or Brg1 leads to specific alterations of cell cycle and differentiation of C2C12 myoblasts
- A, B C2C12 were depleted for Brm (siBrm), Brg1 (siBrg1), or a scrambled (siScr) sequence by small interfering RNA (siRNA) during proliferation (GM), and samples were analyzed at different time points during differentiation (DM 18 h and DM 48 h). Double EdU/MyHC staining was performed after incubation of EdU 12 h before fixing the cells (A). Scale bar, 50 μm. Percentage of EdU-positive cells was calculated counting 10 fields of EdU-positive cells (B, top graph). Proliferation analysis was performed by counting the number/field of siRNA-treated C2C12 at the time point indicated (B, middle graph) and by flow cytometry by BrdU incorporation (B, bottom graph) as percentage of BrdU+ cells. Data are presented as average ± SEM (n = 3).
- C Heat map showing the expression profiles of transcripts in siRNA-treated C2C12 collected at 18 h and 48 h of differentiation.
- D Venn diagram showing overlap between genes downregulated in C2C12 depleted for Brm and Brg1 at early (18 h) and late (48 h) differentiation time points. The percentage of skeletal muscle genes annotated in each category is indicated.

