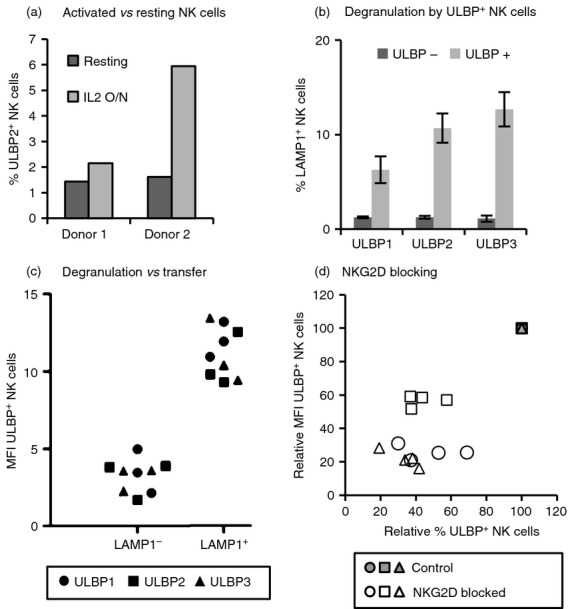
Figure 3.

Transfer depends on ligand recognition and activation of the effector cell. (a) Transfer to resting versus activated natural killer (NK) cells. Resting or interleukin-2 (IL-2) activated NK cells were co-incubated as in Fig.1 with UL16 binding protein 2 (ULBP2) transfectants for 1 hr and analysed by flow cytometry. The percentages of ULBP2+ NK cells from two donors are shown. (b) Degranulation of ULBP+ NK cells. IL-2 activated NK cells were co-incubated for 2 hr with ULBP-transfectants and degranulation was measured as surface LAMP1 expression on NK cells. Data from ULBP-positive and -negative NK cells are shown separately (for gating strategy see Supplementary material, Fig. S3a). Degranulation against CHO-untransfected cells was around 1–2% on average. Six experiments were performed with each ULBP. Average and standard deviation are depicted. (c) NK cells that degranulate acquire more ULBP. The mean fluorescence intensity (MFI) in NK cells staining positive for ULBP that have degranulated (LAMP1+) and those that did not degranulate (LAMP1−) are shown (three co-culture experiments with each NKG2D-L) (for gating strategy see Supplementary material, Fig. S3b). The different symbols represent different ULBPs as shown in panel (d). Blocking NKG2D decreases ligand transfer. ULBP transfer experiments were performed in control, unblocked NK cells (grey symbols) and after blocking with anti-NKG2D monoclonal antibody (white symbols). Different symbols represent different ULBPs: ○ ULBP1, □ ULBP2, Δ ULBP3. The ULBP MFI versus the percentage of ULBP+ NK cells is shown relative to control conditions (unblocked, all grey symbols superimposed at the 100% value). Four experiments for each NKG2D-L are shown.
