Figure 2.

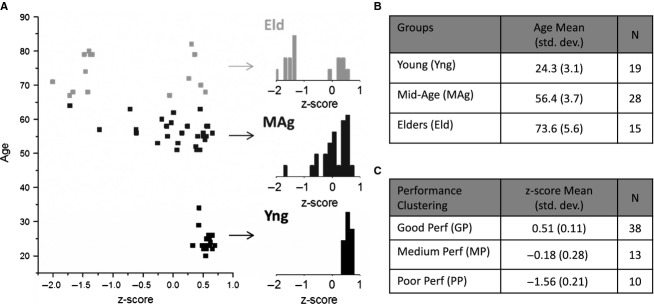
(A) Scatter plot of all subjects included in the study according to age and z-score performance on WCST; inset histograms show an increasing tendency to a bimodal z-score distribution as age increases; (B) statistics for young, mid-age and elders groups; (C) statistics for good performers, medium performers and poor performers clusters.
