Figure 3.

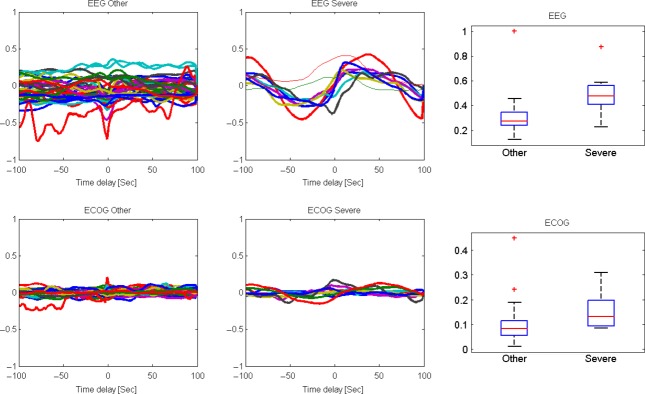
Cross-correlation function (CCF) analysis of the ECOG/EEG response to FHR decelerations. The baseline, mild, and moderate umbilical cord occlusion (UCO) series (denoted “other”) were compared with the ‘Severe’ UCO series when the adaptive brain shut-down was observed in all fetuses. The four leftmost plots represent the cross-correlation function between the smoothed ECOG/EEG amplitude and FHR with a 10 sec moving average with a delay ranging from −100 sec to 100 sec. For example, a time delay of 0 represents the correlation of the ECOG and FHR values at the same time. When a positive delay of 100 sec is used, the ECOG at time t is compared with the FHR at time t + 100. The two leftmost plots are the “other” groups, and the middle plot is the severe group when the adaptive brain shut-down was mostly observed in all fetuses. The upper plots are for the EEG/FHR correlation and the lower plots are for the ECOG/FHR. One can see that the amplitude of correlations is much higher in the severe group than in all other groups (P < 0.01 and P < 0.001, for EEG and ECOG, respectively), and that the amplitude is much larger in the EEG/FHR correlation than in the ECOG/FHR. The difference in the correlation amplitude is presented as a box plot in the two rightmost plots, with the red bar representing the median of the distribution and the box size represent the 25–75th percentiles. + signifies the outliers of the distributions (beyond the 90th percentile values). High amplitude of the correlation between EEG and FHR implies a strong synchronization between the two signals with an average delay of 30 sec.
