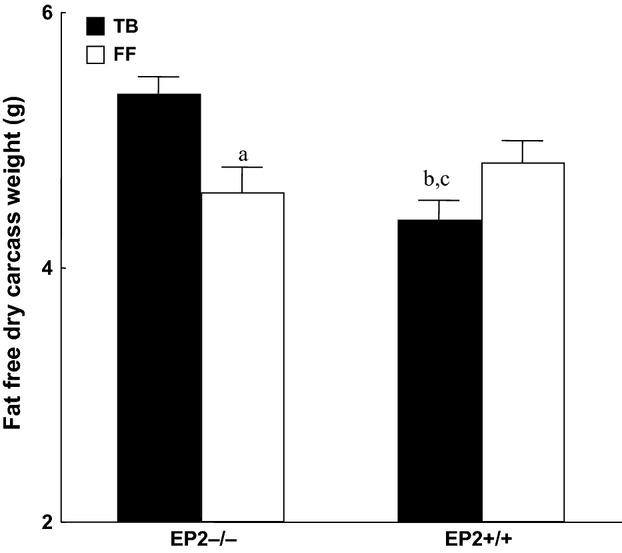
Figure 4.

Whole-body fat-free carcass dry weight at the end of the experiments (day 10) in freely fed tumor-bearing animals (TB) and sham controls (FF) (mean ± SEM, (a) P < 0.01 versus TB EP2−/− ; (b) P < 0.07 versus FF EP2+/+ ; (c) P < 0.001 versus TB EP2−/−; seven animals in each group).
