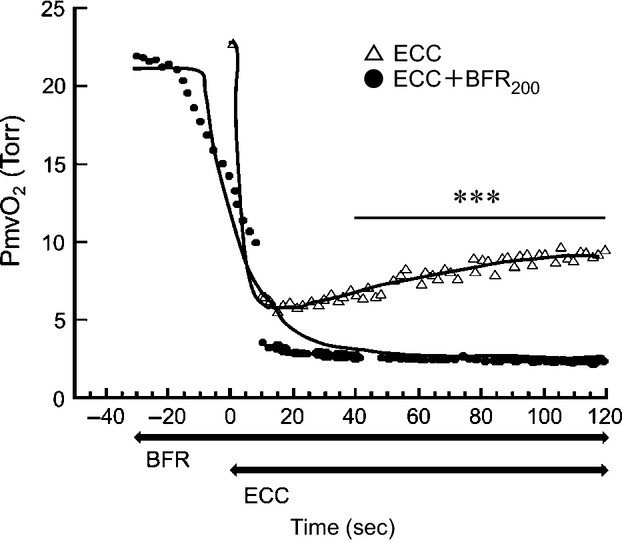
Figure 6.

Typical example of changes in microvascular PO2 (PmvO2). Open triangle shows PmvO2 without blood flow restriction (BFR). Black circle shows PmvO2 with BFR at 200 Torr. Thick lines indicate changes in PmvO2 obtained by curve fitting. The horizontal axis represents time course. Contraction was initiated at time zero. Note that BFR was started 30 sec before the start of electrical stimulation. ***P < 0.001, between conditions. Note that two conditions were compared from 40 to 120 sec after the start of contractions.
