Figure 8.

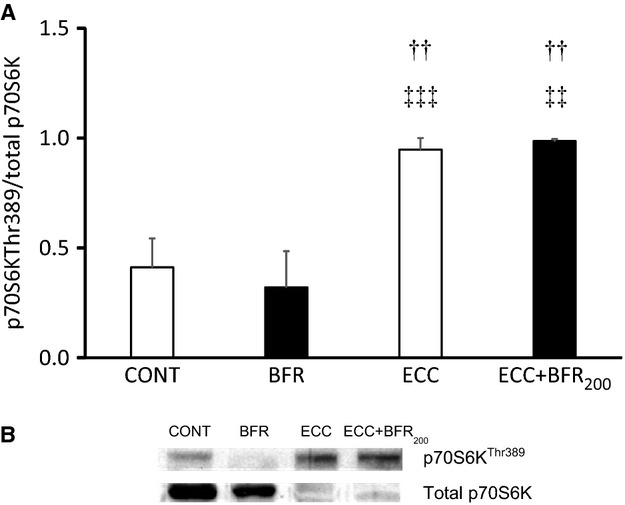
A: Phosphorylation of downstream indicator of mTOR signaling (p70S6K). (A) quantification of phosphorylated p70S6K (Thr389) to total p70S6K in control (CONT), BFR alone (BFR), ECC and ECC + BFR200. ††P < 0.01 versus CONT; ‡‡P < 0.01, ‡‡‡P < 0.001, versus BFR. (B) Representative western blot of phosphorylated p70S6K (Thr389) and total p70S6K contents.
