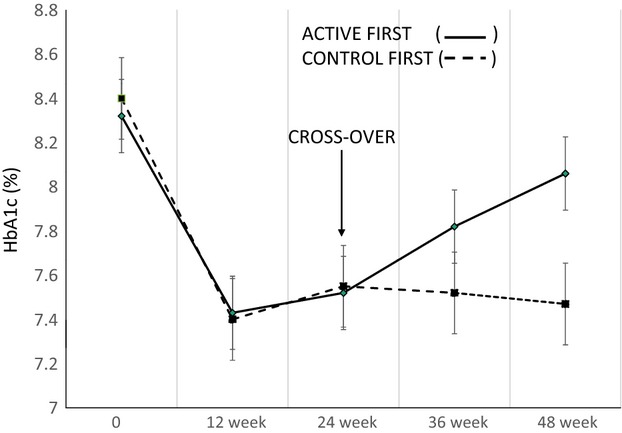
Figure 2.

Mean HbA1c throughout period 1 and 2 in both the cohort with electrical stimulation on during period 1 and off during period 2 (solid line) and the cohort with the electrical stimulation off during period 1 and on during period 2 (dashed line). The slope of the solid line is 0.02%/week, P = 0.047 and that of the dotted line is −0.002%/week, P = 0.78.
