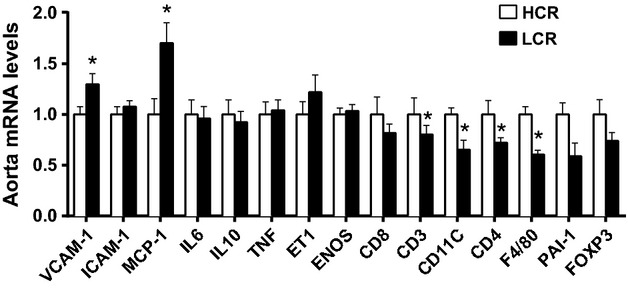
Figure 3.

Aortic gene expression profile of several inflammatory and adhesion molecule-related genes in low-capacity running (LCR), and high-capacity running (HCR) rats. Values are expressed as means ± SEM. For each gene, HCR is used as the reference group and set at 1. *Denotes line difference (P < 0.05).
