
Figure 7.
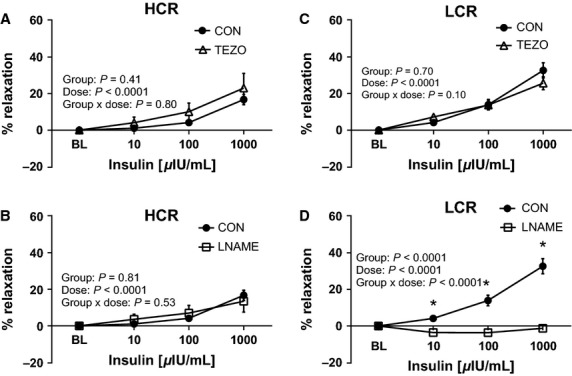
Effects of endothelin-1 receptor blockade with tezosentan (TEZO) and nitric oxide synthase inhibition (L-NAME) on insulin-mediated vasorelaxtion of thoracic aortic rings of low-capacity running (LCR) and high-capacity running (HCR) rats. The left panels (A and B) present data from insulin dose-response curves in HCR, and right panel (C and D) present data from insulin dose-response curves in LCR. Closed circles represent % relaxation in response to insulin alone, open triangles represent % relaxation to insulin in the presence of 3 μM TEZO a nonspecific inhibitor of ET-1 receptors (top panel, A and C) N = 9–16/group, and open squares represent % relaxation to insulin in the presence of 300 μM L-NAME, a nitric oxide synthase inhibitor, (bottom panel, B and D) N = 6–8/group. Insulin μIU/mL, micro-international units per milliliter. Values are expressed as means ± SEM. *Denotes line difference (P < 0.05).