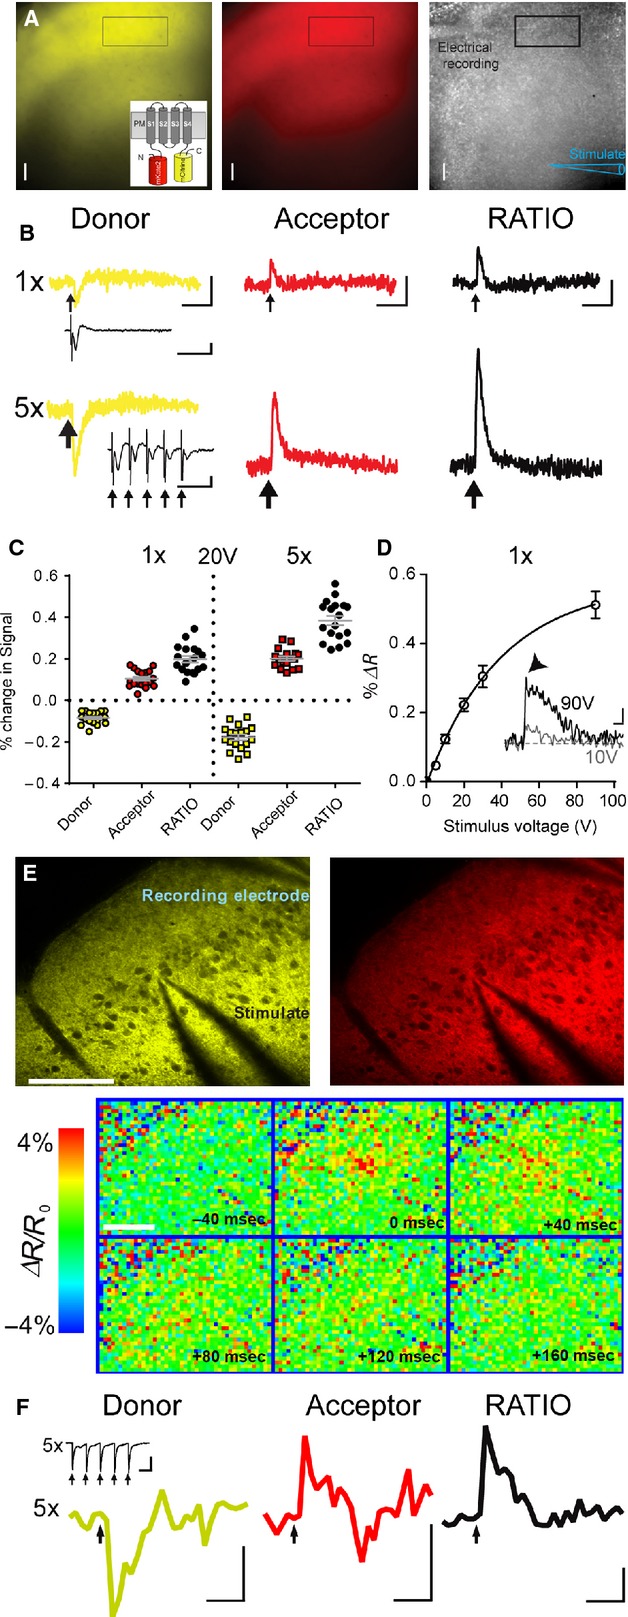
Figure 2.

Butterfly VSFP 2.1 robustly monitors voltage transients from populations of L2/3 pyramidal neurons in response to electrical stimulation. (A) Widefield images of Butterfly expression, mCitrine, yellow and mKate2, red, in a living slice (spatial scale bar 100 μm) with position of electrical stimulation and recording electrodes; inset shows a schematic of Butterfly FRET pairs. (B) Widefield imaging responses from Butterfly mCitrine (donor) and mKate2 (acceptor) (average of 10 sweeps, scale bars 1 sec; 0.1% ΔF/F0 and ΔR/R0 apply to both 1× and 5× responses), from a region of interest placed in L2/3 (rectangle in A), in response to 1× and 5× electrical stimulation (20 V, downward arrows) with accompanying LFPs, scale bars 0.1 mV; 50 ms. Note the decrease in donor fluorescence and increase in acceptor fluorescence as expected from modulation of FRET efficacy. (C) Summary data from seven animals illustrating the robust and reproducible nature of the optical readout, all individual values are shown with mean ± SEM in gray. (D) Butterfly signal as a function of stimulation intensity, values are mean ± SEM (data is from 5 to 8 slices at each stimulation intensity). Inset is an example recording, note the fast (arrowhead) and slow components of the Butterfly signal at high stimulation intensities, scale bars 100 ms; 0.2% ΔR/R0. (E) Imaging of electrical stimulation-induced voltage transients using two-photon microscopy mCitrine (left, yellow) and mKate2 fluorescence (right, red); stimulating (center) and recording electrode (top right corner), scale bar 100 μm. Lower panel shows color-coded sequence of voltage maps 40 ms before to 160 ms after stimulation (t = 0, 5 pulses, 0.2 ms, 100 Hz). Depolarization initiates close to the stimulating electrode tip and then spreads to nearby areas. (F) Donor (mCitrine), Acceptor (mKate2), and Ratio (mKate2/mCitrine) fluorescence transients from the region of interest above (scale bars 1% ΔF/F0 and ΔR/R0; 250 ms). Black arrows indicate time of electrical stimulation. Traces represent average over 25 trials. Inset shows associated LFP, scale bars 1 mV; 10 ms.
