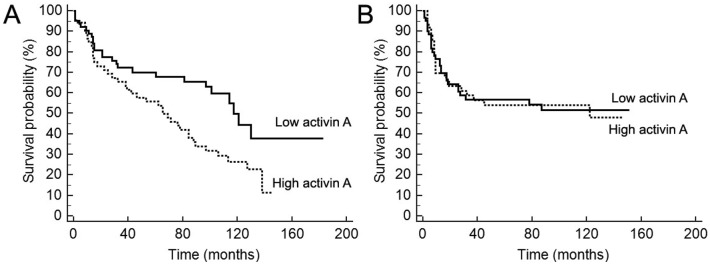
Fig 3. Survival curves based on immunoexpression of activin A.

(A) Overall survival, as determined by the period between the treatment beginning until death or last follow-up information, and (B) disease-free survival, time between initiation of treatment until diagnosis of the recurrence (local, regional or distant) or last follow up information for those without recurrence. Censored deaths are indicated by vertical lines. The univariate analysis revealed that high positivity for activin A is significantly associated with shortened overall survival (p = 0.01).
