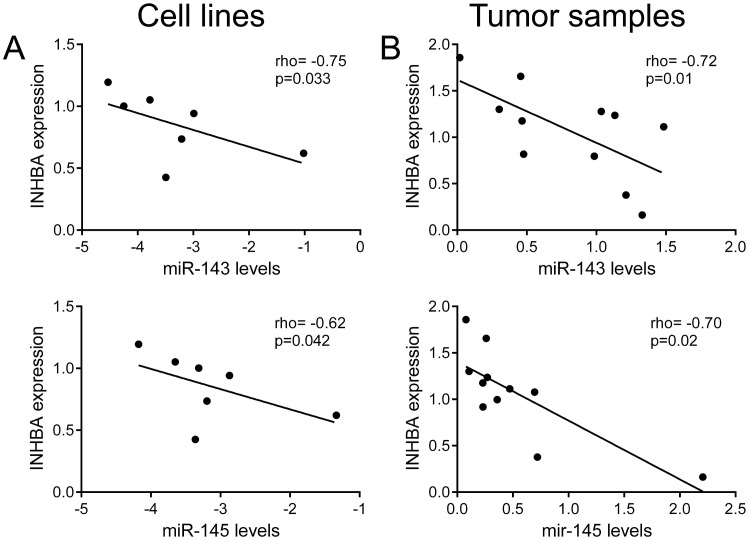
Fig 9. Expression of INHBA is inversely correlated with miR-143 and miR-145 expression in OSCC cells lines and tumor samples.
(A) Spearman correlation analysis between the expressions of INHBA and miR-143 and miR-145 in 7 OSCC cell lines (A) and in 11 OSCC fresh samples (B). A significant inverse correlation was observed between both miR-143 and miR-145 and INHBA expression levels.

