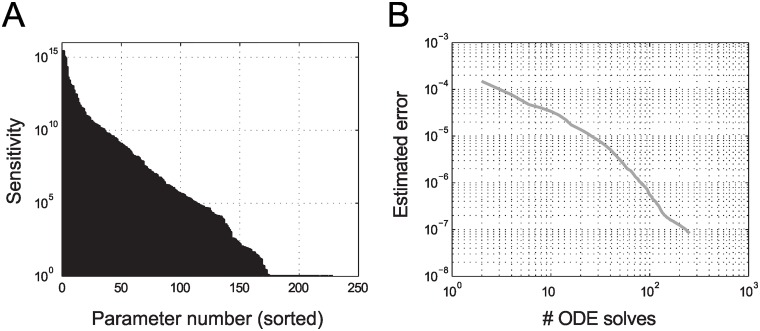
Fig 4. Analysis of coupled signaling pathways.
A: Sensitivity profile: maximum of the derivative of each state variable w.r.t. each of the parameters () for all simulated time points and for all 500 state variables. B: Estimated maximal absolute error for the adaptive interpolation for all 500 state variables with respect to the number of ODE solves in the region p 0 ± 0.01p 0. Error curves for adaptively expanded regions show a similar trend (see S1 Text).

