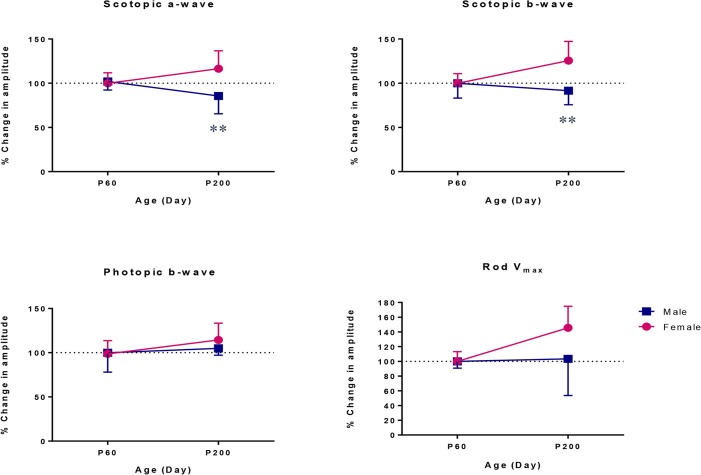
Fig 3. Percent changes in retinal function of male and female rats between P60 and P200 as determined with the retinal maturation index.
The retinal maturation index represents the average (percentage) of the ratios (P200/P60 X 100) for ERG parameters (scotopic a-wave, scotopic b-wave, photopic b-wave, rod Vmax). ** P < 0.01 indicates significant difference between male and female rats at P200. Values are given as mean ± SD.

