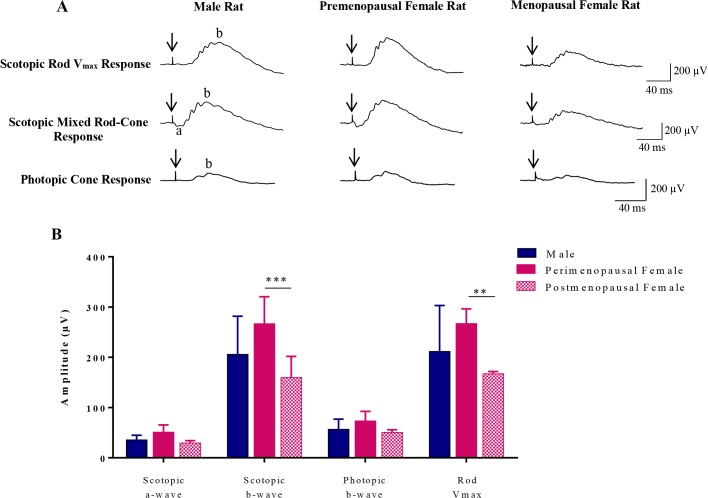
Fig 5. (A) Representative scotopic (mixed rod-cone and rod Vmax) and photopic ERGs recorded from a male rat (first column), premenopausal and menopausal female rats (second and third column, respectively) at age 18 months. (B) Comparison of ERG amplitudes (scotopic a-wave, scotopic b-wave, photopic b-wave, and rod Vmax) measured from male rats, premenopausal and menopausal female rats.
**P < 0.01; *** P < 0.001 indicate significant differences between premenopausal and menopausal female rats. Values are given as mean ± SD. Vertical arrows correspond to the stimulus onset. Horizontal calibration: 40 msec. Vertical calibration: 200 μV. Abbreviations: a: a-wave; b: b-wave.

