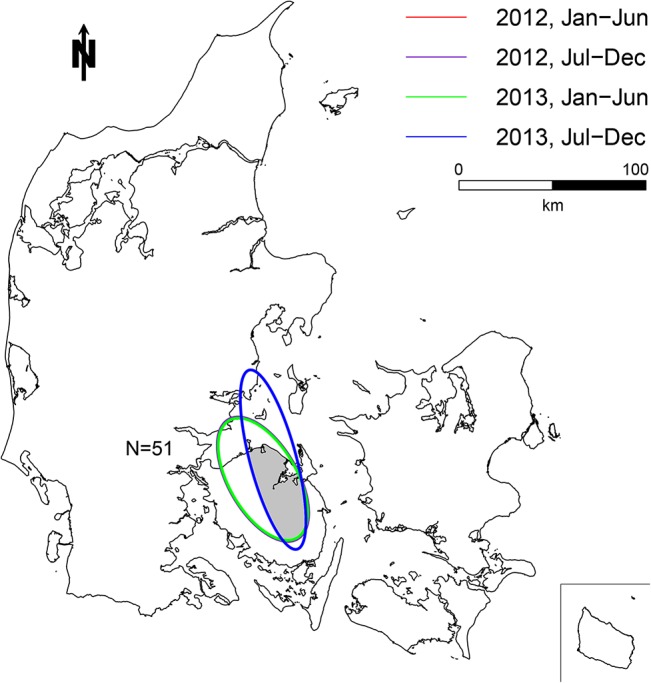
Fig 4. Map of the univariate persistent cluster of antimicrobials prescribed for sows.

51 farms located in one persistent cluster area. Each ellipse illustrates a significant cluster (p<0.05) in one of the four time periods. The three significant clusters from January 2012 to June 2013 lie on top of each other, which is why only two ellipses are visible. N indicates the number of farms inside the persistent cluster area.
