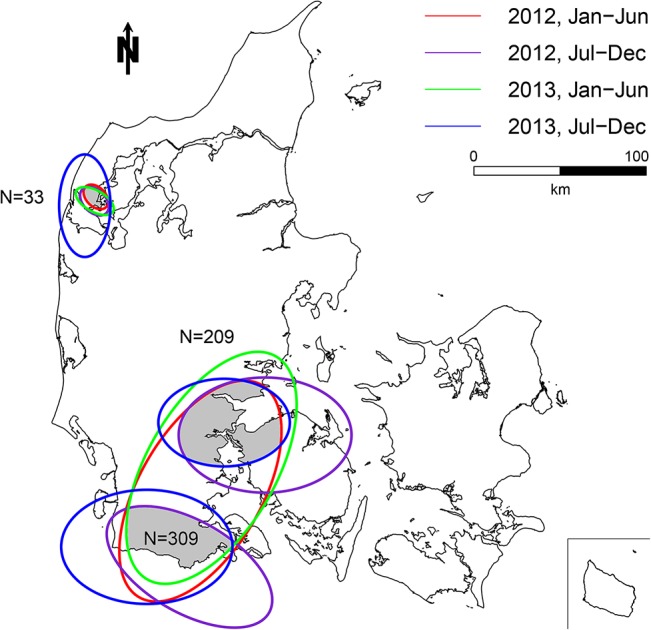
Fig 5. Map of the multivariate persistent clusters.

Each ellipse illustrates a significant cluster (p<0.05) in one of the four time periods. The persistent clusters include a total of 551 farms situated in three distinct geographical areas. N indicates the number of farms inside each of the persistent cluster areas.
