
Fig 5. Average number of changes above the threshold per gene.
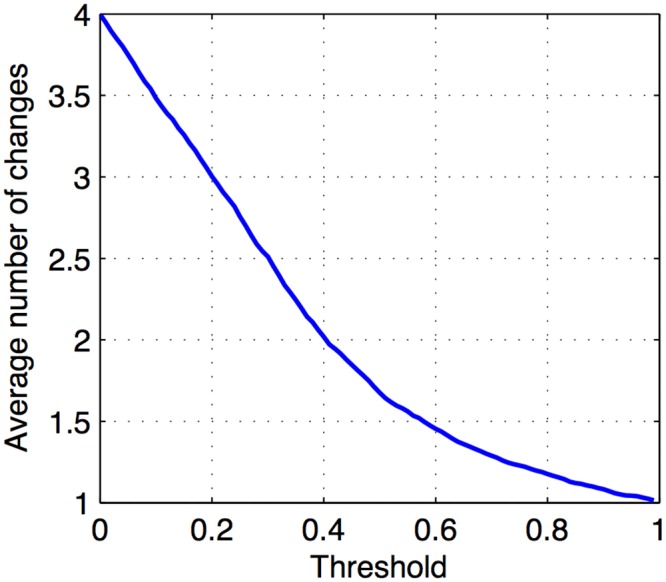
Changes in expression (s n(g i, k), k = 1,…,4) for Initiation stage genes were thresholded with a range of cutoff values. The graph shows the average number of changes that exceed the threshold per gene out of 4 possible changes.