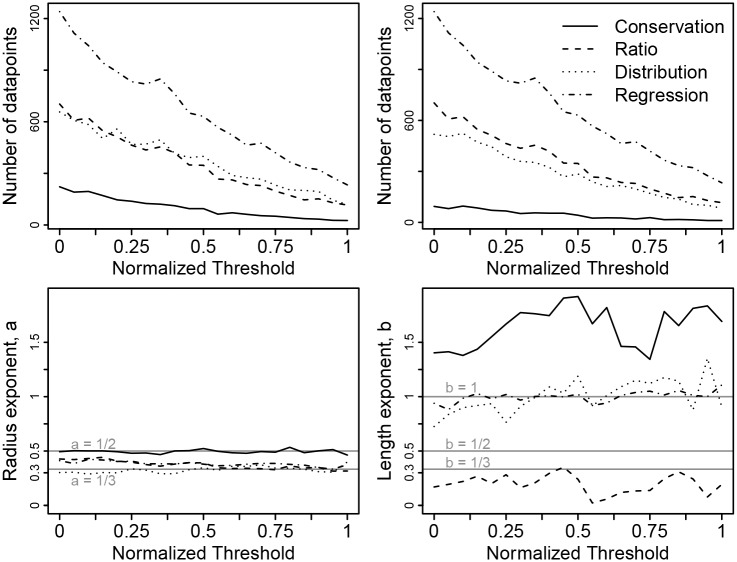
Fig 5. Sensitivity of the measured scaling exponents to the threshold intensity values that select which voxels are part of the vessel lumen.
We normalized the threshold so that the minimum threshold (0.0) is the value used in our results and figures above, while the maximum threshold (1.0) is the largest value for which at least 30 vessel segments are visible. We re-scaled the threshold values because the raw value is different for each image. The top left panel shows the number of vessel segments used to calculate the four scaling exponents for vessel radius versus the normalized threshold value, as in the N column of Table 1. The top right panel shows the number of vessel segments used to calculate the four scaling exponents for vessel length versus the normalized threshold value, as in the N column of Table 1. For both of these top two panels, the number of data points decreases with threshold value as it must. The bottom left panel depicts how the four calculated scaling exponents for vessel radius vary with normalized threshold value. The bottom right panel depicts how the four calculated scaling exponents for vessel length vary with normalized threshold value. Horizontal lines indicate points of comparison to theory as described in Table 1.

