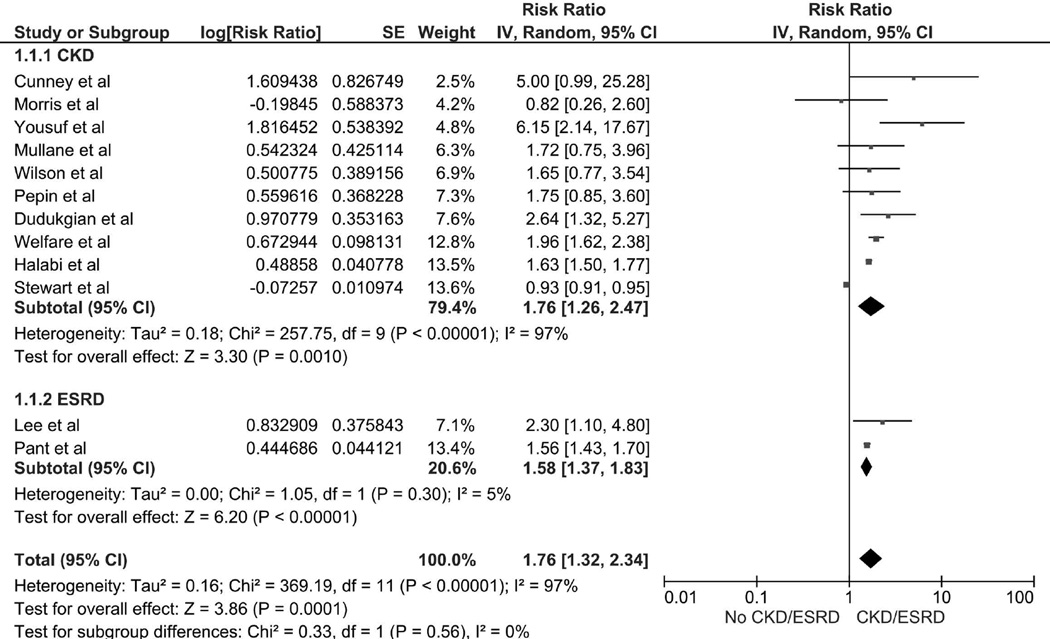
Figure 3.
Forest plot of the all included studies comparing the mortality risk of CDI in patients in CKD or ESRD vs. without CKD or ESRD; square data markers represent risk ratios (RRs); horizontal lines, the 95% CIs with marker size reflecting the statistical weight of the study using random-effects meta-analysis. A diamond data marker represents the overall RR and 95% CI for the outcome of interest. IV, inverse variance; SE, standard error.

