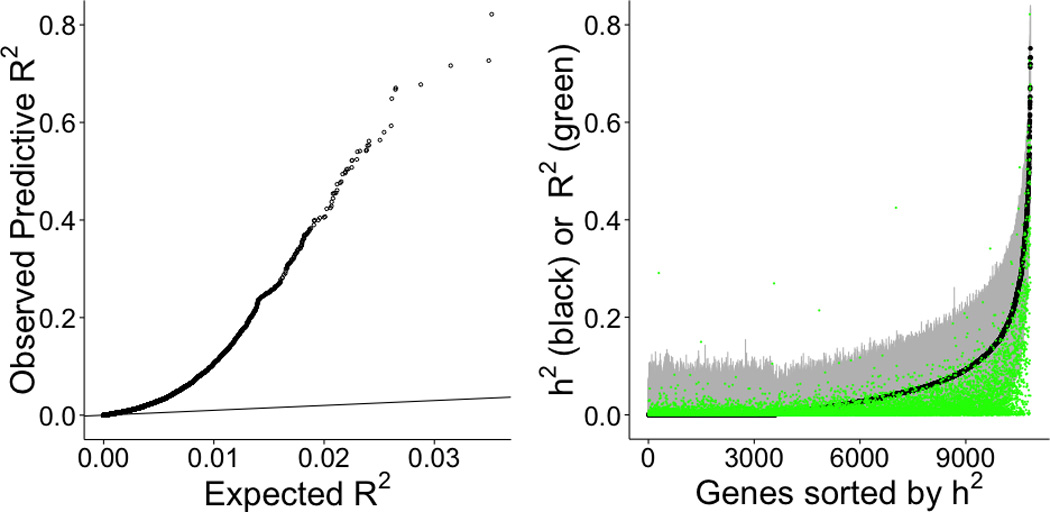
Figure 4. Prediction performance of elastic net tested on a separate cohort.

Using whole blood prediction models trained in DGN, we compared predicted levels of expression with observed levels on lymphoblastoid cell lines from the 1000 Genomes project. RNA-sequenced data (n=421) on these cell lines have been made publicly available by the GEUVADIS consortium. Left panel shows the squared correlation, R2, between predicted and observed levels plotted against the null distribution of R2 Right panel shows prediction performance (R2 of GReX vs. observed expression in green) compared to GEUVADIS gene expression heritability (h2) estimates (black with 95% confidence interval in gray).
