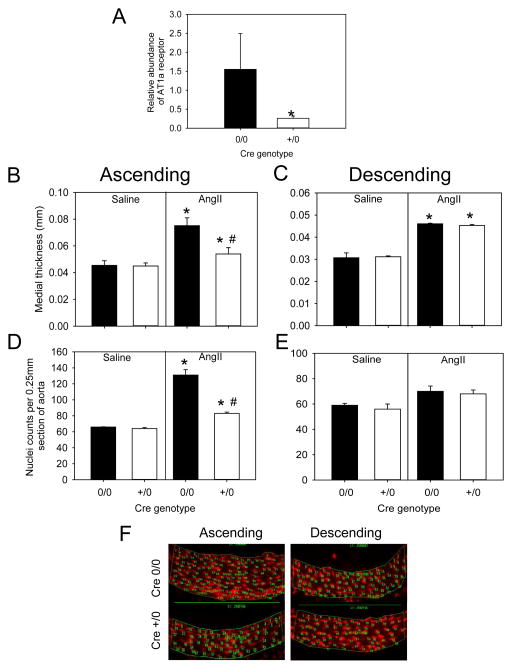
Figure 4. Fibroblast cell-specific AT1a receptor deficiency decreased AngII induced medial hyperplasia in the ascending aorta.
(A) Abundance of AT1a receptor mRNA in aortic adventitia of AT1a receptor floxed S100A4-Cre 0/0 (n=3) and S100A4-Cre +/0 (n=3) mice. Histobars with error bars represent mean ± SEM. * denotes P<0.05 in comparing S100A4-Cre 0/0 versus S100A4-Cre +/0 mice by Student’s t-test. Medial thickness was measured in ascending (B) and descending (C) aortas from AT1a receptor floxed S100A4-Cre 0/0 and S100A4-Cre +/0 mice infused with either saline (n=4–6 in each genotype) or AngII (n=8–10 in each genotype). Histobars with error bars are mean ± SEMs. * denotes P<0.05 when comparing saline versus AngII and # denotes P<0.05 when comparing S100A4-Cre 0/0 versus S100A4-Cre +/0 in AngII infused groups by two-way ANOVA with Holm-Sidak post hoc test. Nuclei density represented by normalization to aortic section length (0.25 mm) in ascending (D) and descending (E) sections from AT1a receptor floxed S100A4-Cre 0/0 and S100A4-Cre +/0 mice infused with either saline (n=3 in each genotype) or AngII (n=5 in each genotype). Histobars with error bars represent mean ± SEMs. * denotes P<0.05 when comparing saline versus AngII within Cre genotype and # denotes P<0.05 when comparing S100A4-Cre 0/0 versus S100A4-Cre +/0 in AngII infused groups of the ascending aortic by two-way ANOVA with Holm-Sidak post hoc test. (F) Representative photomicrographs of ascending and descending aortas stained with propidium iodide from AT1a receptor S100A4-Cre 0/0 and S100A4-Cre +/0 mice infused with AngII.

