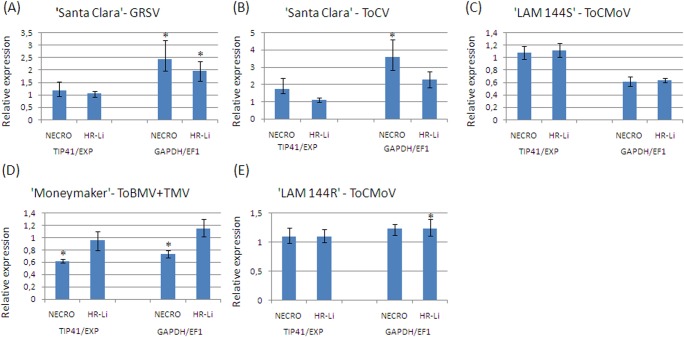
Fig 4. Expression quantification of target genes in four tomato-virus-pathosystems using different combinations of normalizers.
The normalization of relative expression data was made with two combinations of reference genes: the two most stable genes (TIP41 and EXP) and the two least stable genes (GAPDH and EF1) genes. The relative expression of two target genes [Necrotic spotted lesions 1 (NECRO) and HR-like lesion inducer (HR-Li)] was evaluated in five pathosystems after virus inoculation relative to their respective mock-inoculated controls. (A) ‘Santa Clara’ 100 DAI with GRSV; (B) ‘Santa Clara’ 100 DAI with ToCV; (C) ‘LAM 144S’ 25 DAI with ToCMoV; (D)‘Moneymaker’ 18 DAI with ToBMV and (E) ‘LAM 144R’ 25 DAI with ToCMoV. Error bars represent the standard deviation of three technical replicates.

