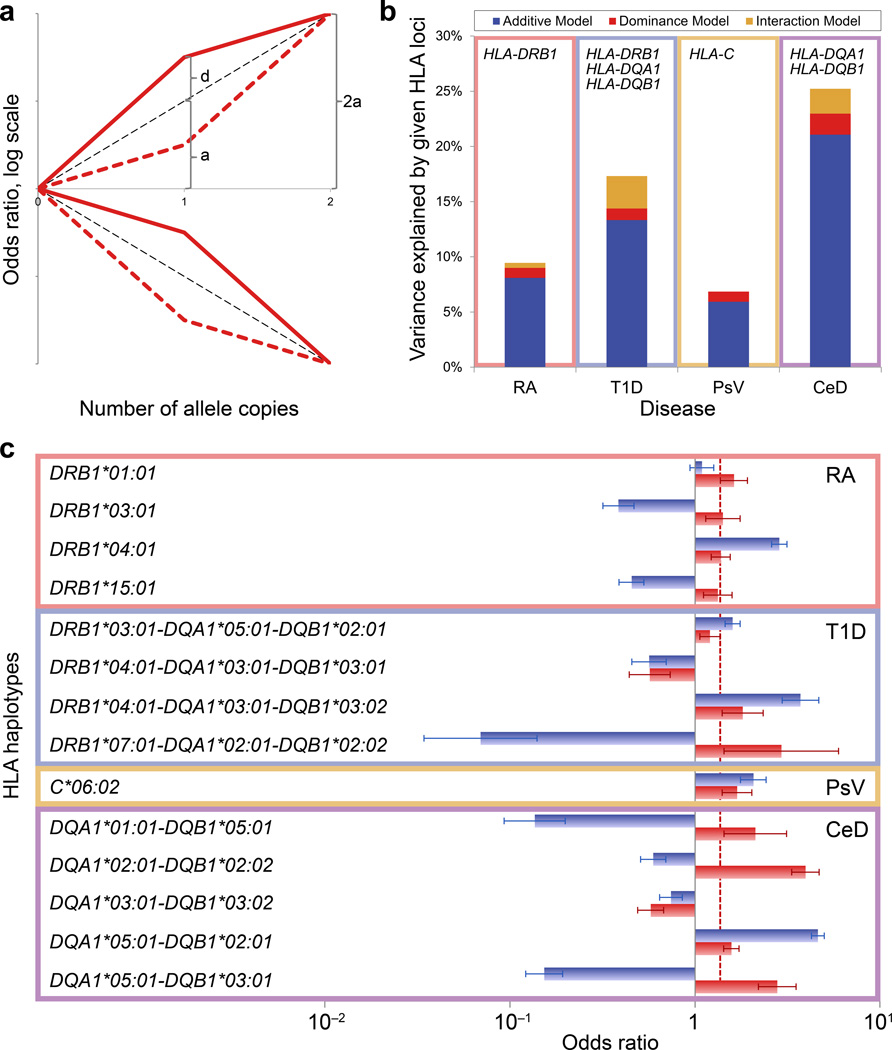
Figure 2. Non-additive contribution of the HLA to autoimmune disease risk.
(a) Schematic overview of possible non-additive scenarios. The log-odds for heterozygote genotypes can be divided into an additive effect a and a dominance component d, which represents the departure from additivity. Depending on the signs of a and d, there are four possible scenarios, represented by red lines. Dashed black lines represent the expected log-odds under a purely additive model (d = 0). As an example, the values of a and d are indicated for the solid red line (risk variant with positive dominance component). (b) Phenotypic variance explained by additive, dominant, and interaction effects of HLA haplotypes, respectively, for each disease with a significant non-additive HLA contribution: rheumatoid arthritis (RA), type 1 diabetes (T1D), psoriasis vulgaris (PsV), celiac disease (CeD). (c) For each common HLA haplotype with significant non-additive effect in RA, T1D, PsV, and CeD, we calculated the additive (blue bars) and dominance (red bars) components of the log-odds for heterozygotes. The dashed line indicates the median of the dominance components depicted in the figure. Error bars represent 95% confidence intervals.

