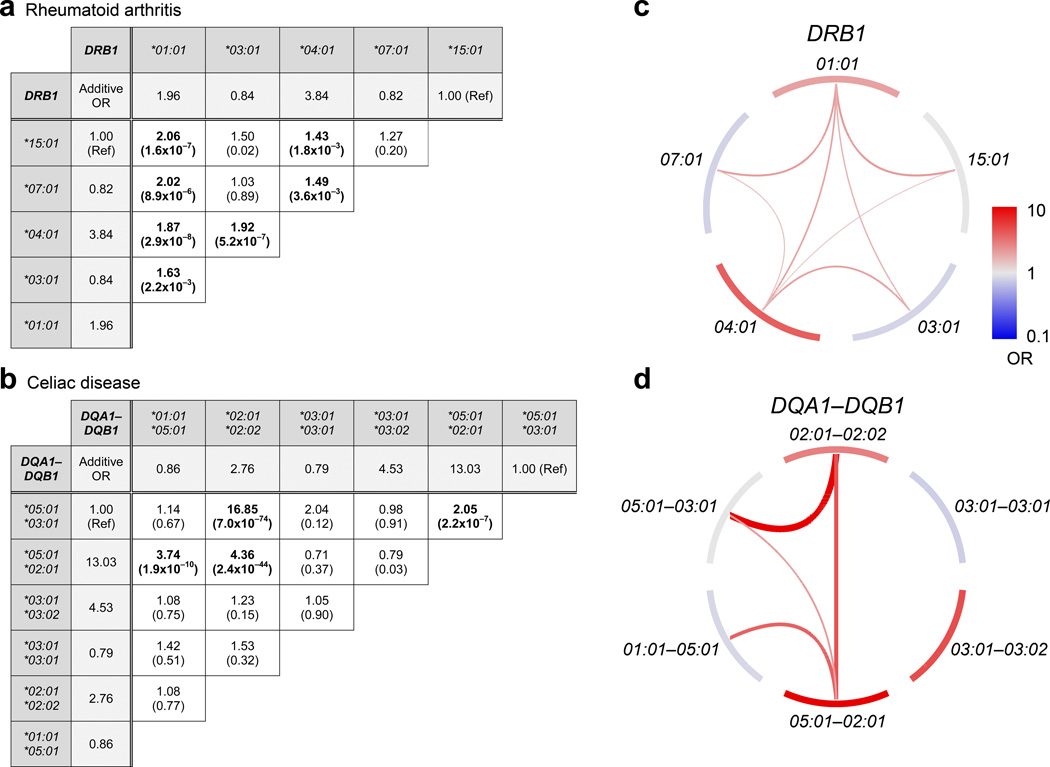
Figure 3. Interaction effects among HLA haplotypes.
Pairs of common haplotypes with significant interaction effects (beyond the combined additive effect) are shown. For (a) rheumatoid arthritis (HLA-DRB1) and (b) celiac disease (HLA-DQA1-DQB1) we ran a global regression model that included additive terms for each haplotype and interaction terms between each pair of haplotypes. The fold change in odds ratio (OR) due to the inclusion of interaction effects is displayed for each haplotype pair, and the P-value associated with each interaction OR is shown in parentheses. Additive ORs are also displayed for each haplotype, shaded in light gray. The total OR of a haplotype pair is the product of two haplotypic additive ORs and one interaction OR. “Ref” indicates the reference haplotype for each regression model. Bolded values indicate interactions that are significant after multiple test correction (P < 0.05/10 = 0.005 for rheumatoid arthritis, P < 0.05/15 = 0.003 for celiac disease). Significant interactions are visualized for (c) HLA-DRB1 (rheumatoid arthritis) and (d) HLA-DQA1-DQB1 (celiac disease). Outer node segments represent haplotypes with the color indicating their additive disease contribution, while internal arches represent significant interaction effects. For both nodes and arches, red color indicates disease risk and blue indicates protection, with effect sizes following the scale in panel c. The effect sizes of the interactions are also represented by the width of the arches.

