
Fig. 4.
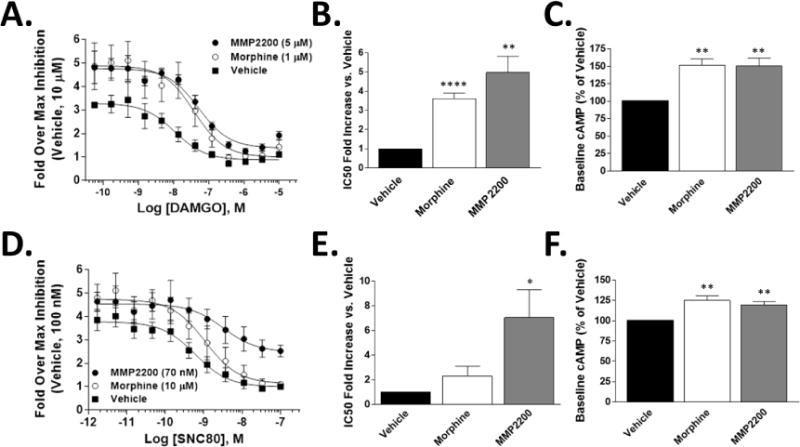
CHO cells expressing human mu (A-C) or delta receptor (D-F) were treated for 20 hrs with vehicle, morphine (1 μM for mu, 10 μM for delta), or MMP-2200 (5 μM for mu, 70 nM for delta). The cells were then stimulated with forskolin (100 μM) and an agonist concentration curve (DAMGO for mu, SNC80 for delta), and cAMP levels quantified. Sample size n=4 independent experiments. Values calculated from each individual experiment, reported as mean ± SEM. *, **, **** = p<0.05, 0.01, 0.0001 via unpaired 2 tailed t-test vs. Vehicle group. A) Concentration curves for mu receptor experiments. The mean from each individual experiment (n=4) used as a single value for the summary curve. B) The fold IC50 shift vs. the Vehicle value is reported for mu receptor (A), a marker of tolerance. C) The percent increase in cAMP baseline over the Vehicle for mu receptor (A) is reported, which is equally elevated (~150%) in both morphine and MMP-2200. D) Concentration curves for delta receptor experiments. The mean from each individual experiment (n=4) used as a single value for the summary curve. E) The fold IC50 shift vs. the Vehicle value is reported for delta receptor (D), a marker of tolerance. F) The percent increase in cAMP baseline over the Vehicle for delta receptor (D) is reported, which is equally elevated (~120%) in both morphine and MMP-2200.