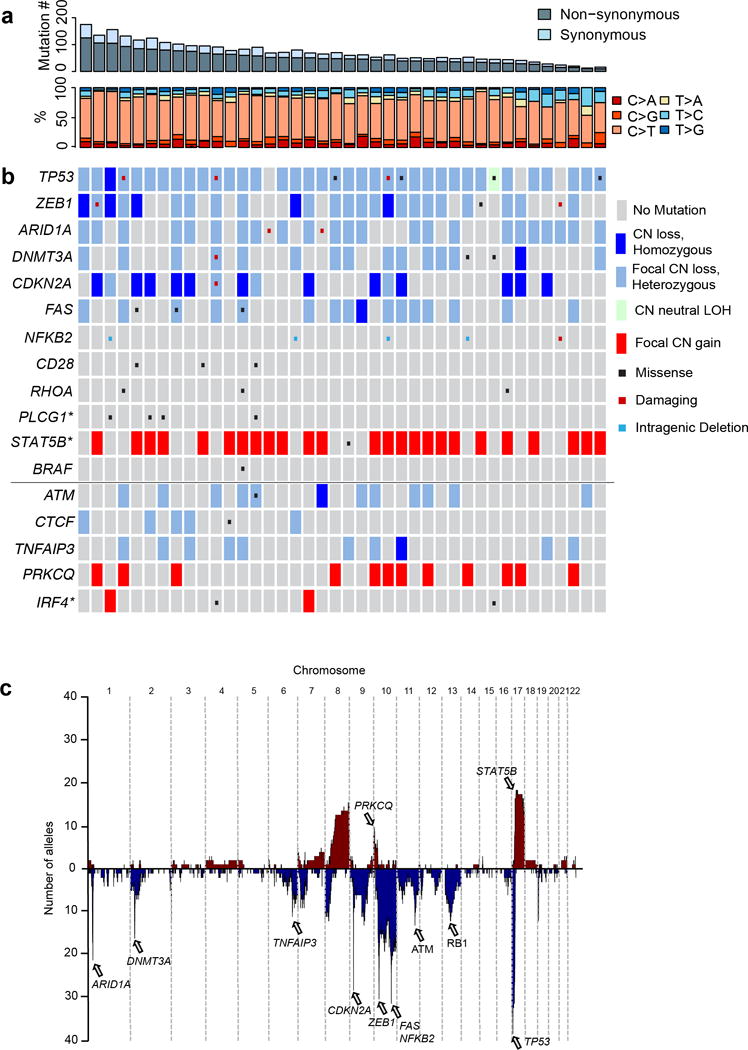
Figure 1. Landscape of somatic alterations in CTCL.

Each column shows data for one CTCL. (a) The number of SSNVs in each CTCL along with the relative frequency of transitions and transversions is shown. (b) Select significant somatic alterations identified by whole exome sequencing are shown. Genes above the solid horizontal line have significant support for gene localizing mutations. Genes shown below the solid horizontal line represent putative driver genes residing on significant narrow focal SCNVs (< 10 genes in GISTIC interval). * indicates a Q-value between 0.1 and 0.25 supporting the specific gene indicated. (c) Composite plot of somatic copy number abnormalities. Listed are select implicated driver genes.
