Figure 6.
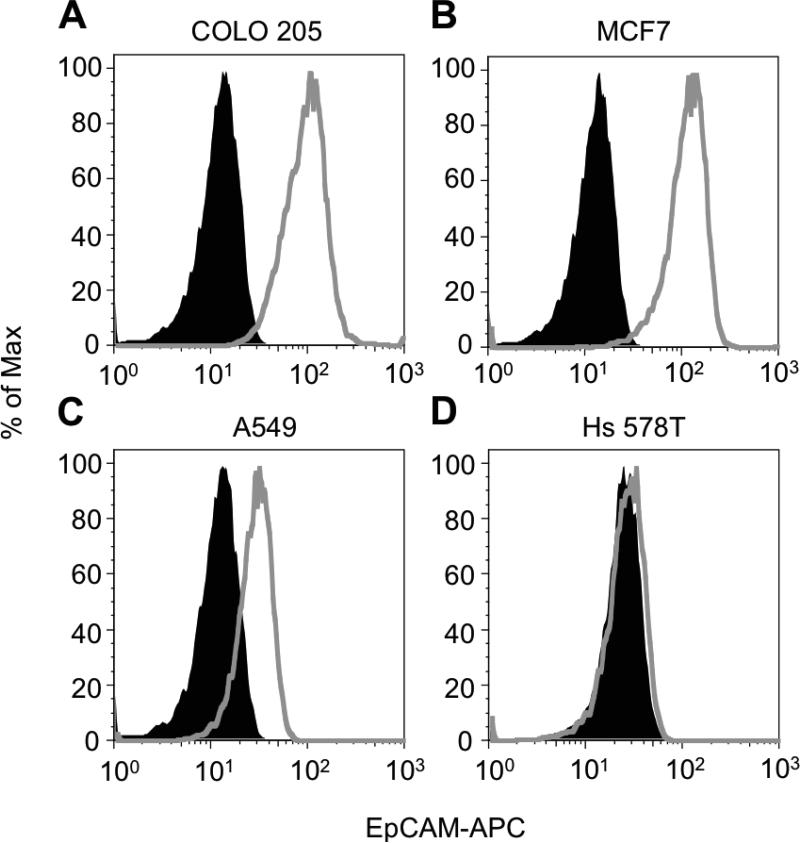
Epithelial cell adhesion molecule (EpCAM) surface expression on tumor cell lines. (A-D) Flow cytometry histograms of EpCAM surface expression on COLO 205 (A), MCF7 (B), A549 (C), and Hs 578T (D) tumor cells. Grey histograms denote tumor cell samples labeled with allophycocyanin (APC) fluorescent anti-EpCAM antibodies. Black histograms denote tumor cell samples labeled with APC isotype controls. A minimum of 104 cells was analyzed for each sample. % Of Max: number of detected cells in each bin divided by the number of cells in the bin that contains the largest number of cells.

