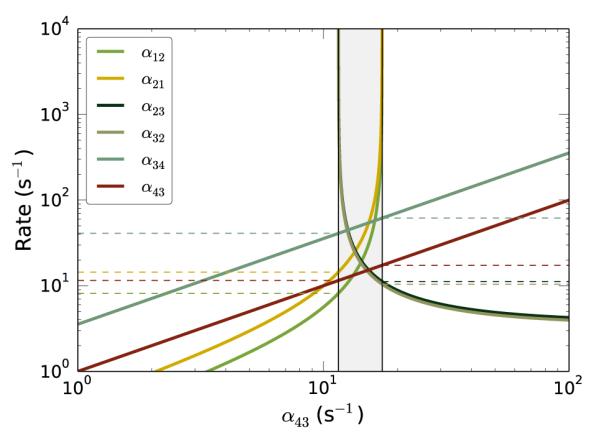
Figure 2.

Rate constants for the four-state model as a function of α43. The gray region contains the solutions where all rate constants are positive. Both axes are log scaled; so, any incompatible rates (negative valued) are not shown. The points where rate constants switch from being negative to positive valued are denoted with a black, vertical line. Horizontal, dashed lines denote upper or lower bounds for particular rate constants
