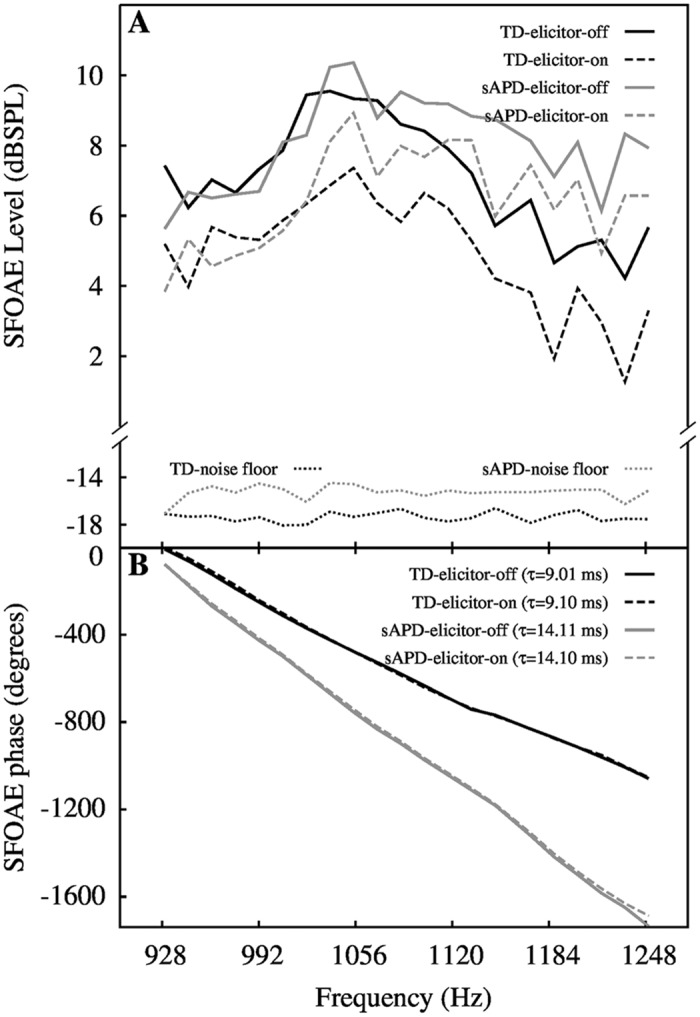
Fig 3. Mean SFOAE spectrum and example phase data.

Panel-A shows mean (averaged across participants) SFOAE level as a function of frequency. Groups are indicated by colors (black for TD and grey for sAPD). In panel-B, SFOAE phase slopes for two children, one from TD and one from sAPD group, for elicitor-off and elicitor-on conditions are shown. The two phase gradient examples illustrate differences in the obtained τ. In both plots, solid lines indicate elicitor-off, and dashed lines indicate elicitor-on condition.
