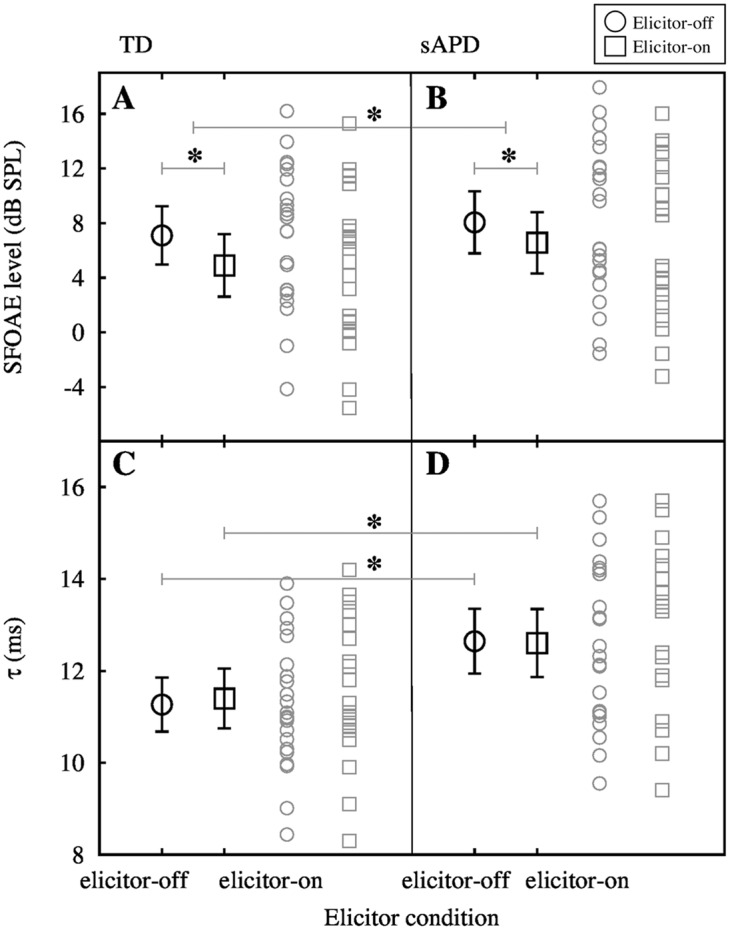
Fig 4. Mean MOC inhibition of SFOAE level and τ.

Panels A and B show mean SFOAE level (averaged across participants and frequencies) for TD and sAPD groups, respectively. Error bars around the mean are 95% confidence intervals. Matching grey symbols are raw data. Panels C and D show mean τ for both TD and sAPD groups respectively. In both panels open circles represent elicitor-off condition and open boxes represent elicitor-on condition. Significant mean differences are marked with asterisks.
