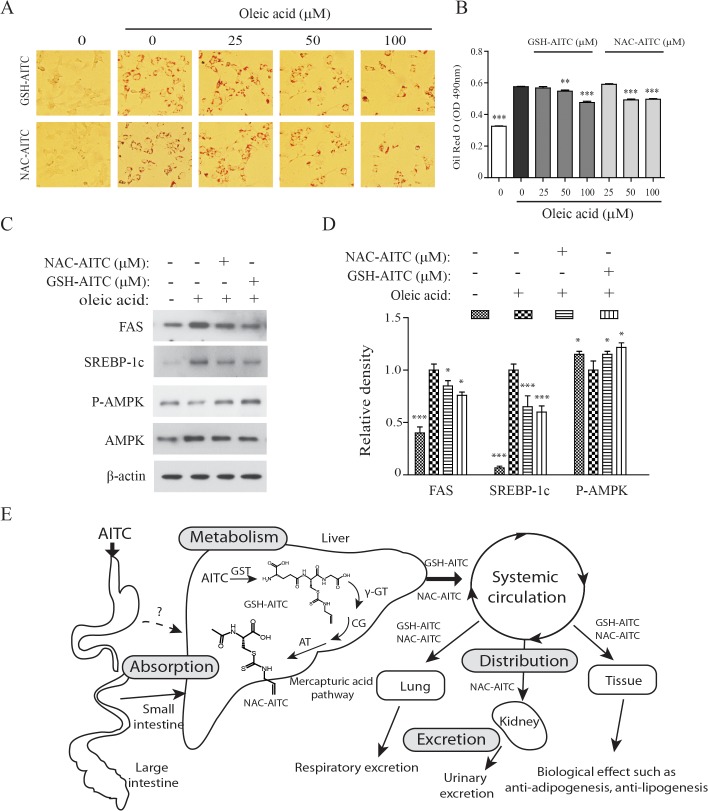
Fig 6. Inhibitory effects of GSH-AITC and NAC-AITC on oleic acid-induced lipid accumulation.
Hepa 1–6 cells were treated with the indicated concentrations of GSH-AITC and NAC-AITC in the presence or absence of 100 μM oleic acid. Cells were stained with Oil Red O (A). The intracellular triglyceride levels were indexed by quantifying the Oil Red O extracted from the cells by spectroscopy performed at an excitation wavelength of 490 nm (B). The SCD1, FAS, and AMPK levels in cell lysates were detected by western blot analysis. To compare and quantify levels of proteins, the density of each band was measured using ImageJ software with β–actin as an internal reference (C). Values are reported as means ± SD (n = 3, ** p < 0.01; *** p < 0.001 compared to oleic acid only). (D) Proposed metabolic pathway of AITC after oral administration of AITC.

