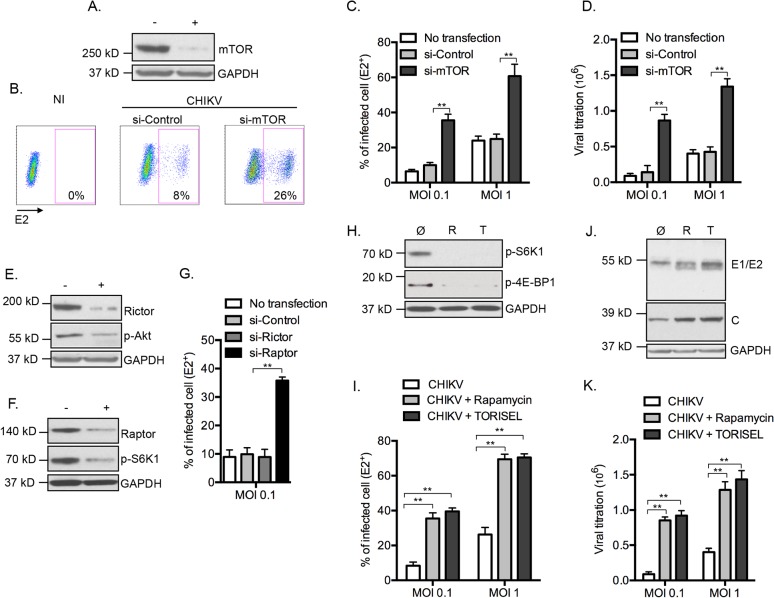
Fig 1. Inhibition of mTORC1 favors CHIKV infection.
(A-D) MEFs pretreated with mtor siRNA for 3d were infected by CHIKV at indicated MOI for 24h. (A) Western blot was performed 24h post-infection (p.i.) using anti-mTOR and anti-GAPD antibodies. Similar results were observed in four independent experiments. (B, C) The percentage of intracellular E2 staining was analyzed using an anti-E2 antibody, assessed using flow cytometer. Representative FACS data is shown (B), and results shown for MOI 0.1 and 1.0 (C). Greater than 10,000 cells were acquired. Bars indicate mean values ±SEM from five independent experiments. (D) Extracellular viral titers were determined at 24h p.i. and results were expressed as TCID50/ml. Bars indicate mean values ±SEM from four independent experiments. (E-G) MEFs pretreated with siRNA targeting rictor or raptor were infected by CHIKV (MOI = 0.1) for 24h. (E, F) Western blot was performed using anti-rictor, anti-raptor and anti-GAPD antibodies. Reduced activity of mTORC1 and mTORC2 was confirmed by following the phosphorylation on tyrosine 389 of S6K-1 (p-S6K1) and the phosphorylation on serine 473 of Akt (p-Akt), respectively. Similar results were observed in three independent experiments. CHIKV protein E2 was stained and the percentage of positive cells was determined and represented as graph (G). Bars indicate mean values ±SEM from three independent experiments. (H) MEFs were treated with Rapamycin (100 nM) or TORISEL (0.1 mg/ml) for 24h and reduced activity of mTORC1 was confirmed by following the phosphorylation on tyrosine 389 of S6K-1 (pS6K1) and the phosphorylation on serine 65 of 4E-BP1 (p-4E-BP1). Similar results were observed in five independent experiments. (I-K) MEFs were infected with CHIKV at indicated MOI for 24h in presence of Rapamycin (100 nM) or TORISEL (0.1 mg/ml). (I) The percentage of E2 positive cells is depicted. Bars indicate mean values ±SEM from five independent experiments. (J) Western blot was performed using antibodies against envelope proteins 1 and 2 (anti-E1/E2), nucleocapsid (anti-C) and GAPDH. Similar results were observed in two independent experiments. (K) Extracellular viral titers were determined at 24h p.i. Results were expressed as TCID50/ml. Bars indicate mean values ±SEM from four independent experiments. Student’s test **, P < 0.05. +, indicates si-mtor (A), si-rictor (E) and si-raptor (F);-, si-control; Ø, control buffer for inihibitor experiments; R, Rapamycin; T, TORISEL.

