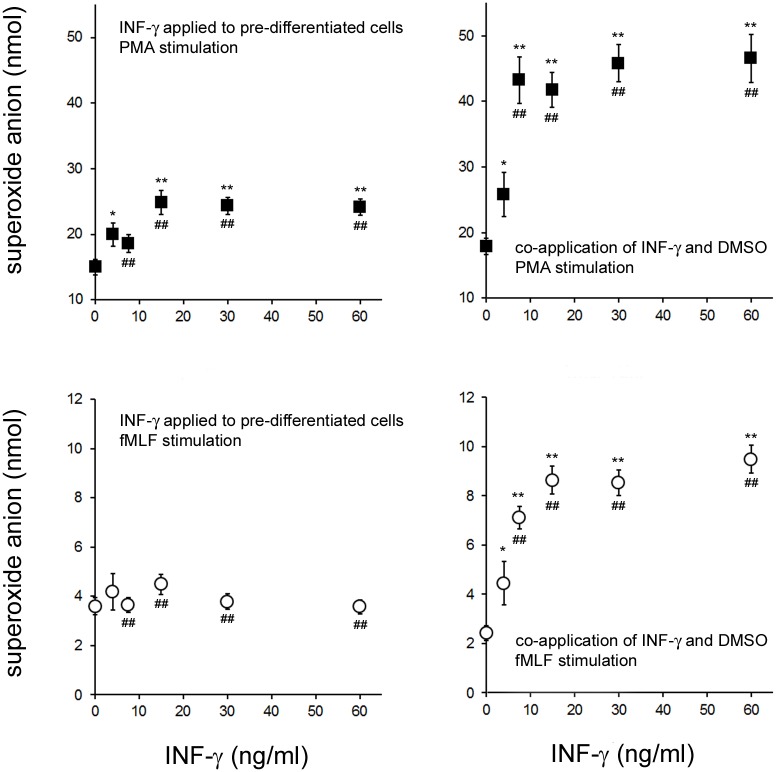
Fig 2. Stimulation of PLB-985 Nox2 Activity when IFN-γ was Applied After or During Cell Differentiation.
In the two graphs on the left, PLB-985 cells were treated for 72 hours with 1.3% DMSO (pre-differentiated) and were then treated for 3 hours with the indicated concentrations of IFN-γ. The cells were then stimulated with PMA (top graph) or fMLF (bottom graph) and the amount of O2 - generated in 10 minutes (for PMA) or 5 minutes (for fMLF) was measured. In the two graphs on the right, PLB-985 cells were cultured for 72 hours in the presence of 1.3% DMSO and simultaneously treated with the indicated concentrations of IFN-γ(co-application). The cells were then stimulated with the Nox2 agonists PMA (top graph) or fMLF (bottom graph) and the amount of O2 - generated after 10 minutes (for PMA) or 5 minutes (for fMLF) was measured. The error bars are +/- SEM and n = at least 12 measurements from at least 2 independently treated cultures of PLB-985 cells. For a given graph, * indicates a significant difference (p<0.05; two tailed t-test) and ** indicates a very significant difference (p<0.005; two tailed t-test) between O2 - produced at a given IFN-γ concentration and O2 - formed in the corresponding 0ng/ml-IFN-γ condition. For a given agonist (PMA or fMLF), ## indicates a very significant difference (p<0.005; two tailed t-test) between the increase in O2 - formed due to a given IFN-γ concentration and the equivalent increase in the alternative IFN-γ application protocol (co-application of IFN-γ and DMSO versus IFN-γ application to pre-differentiated cells).

