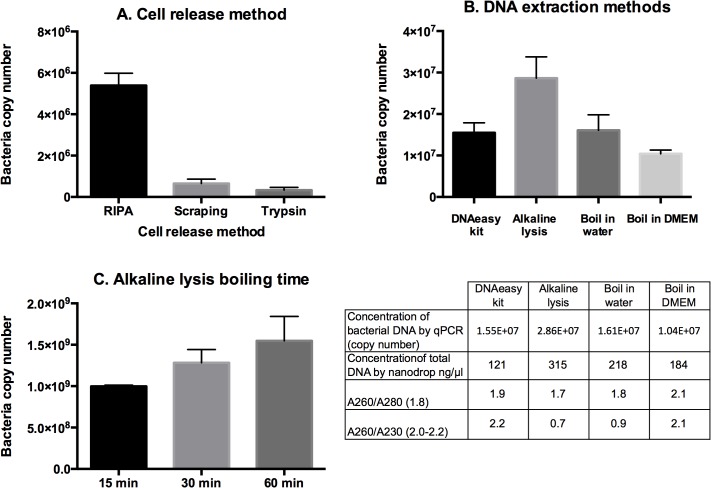
Fig 2. Optimising quantification of O. tsutsugamushi grown in cultured mammalian cells.
Panel A. Levels of bacterial DNA as determined by qPCR, after releasing host cells from tissue culture flasks by different methods. Panel B. A comparison of DNA extraction methods. The graph shows the amount of O. tsutsugamushi-specific DNA detected by qPCR, and the table below shows the total concentration by qPCR or nanodrop analysis, the 260/280 absorption ratio and the 280/230 absorption ratio. Numbers in brackets indicate expected values for pure DNA. Panel C. Levels of bacterial DNA after boiling for different periods of time using the alkaline lysis DNA extraction method.

