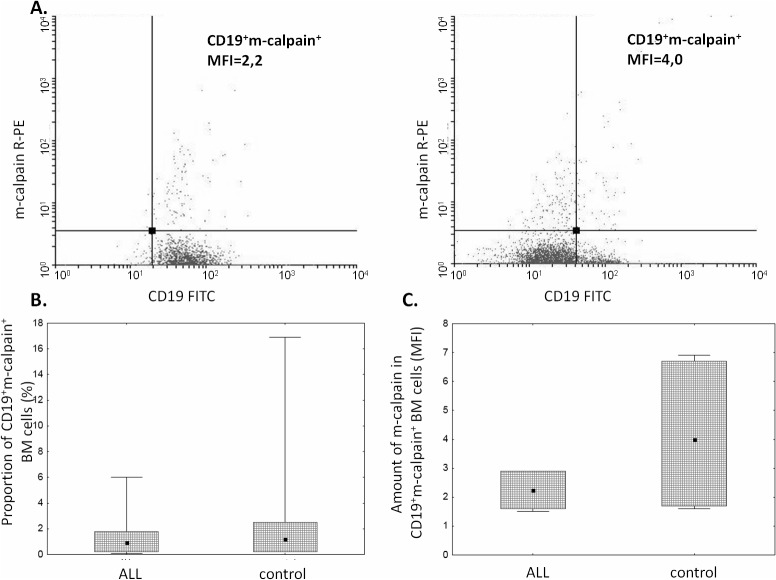
Fig 2. Similar proportions of m-calpain-positive cells and amounts of m-calpain in ALL blasts and control cells.
A. Representative two-parameter plots (dot plots) resulting from simultaneous staining of BM samples (left panel–ALL, right panel–control) with anti-CD19 and anti-m-calpain antibodies. Actual corrected MFI values for calpain signal in CD19+ cells are shown. Details in Materials and Methods. B, C. No significant difference between the proportion of m-calpain-positive cells among ALL blasts and nonmalignant BM B cells (B) and between amount (MFI) (C). Box-and-whisker plots depict the medians, 25th and 75th percentile and range respectively. N(ALL) = 6, N(control) = 6. For the details see Materials and Methods.

