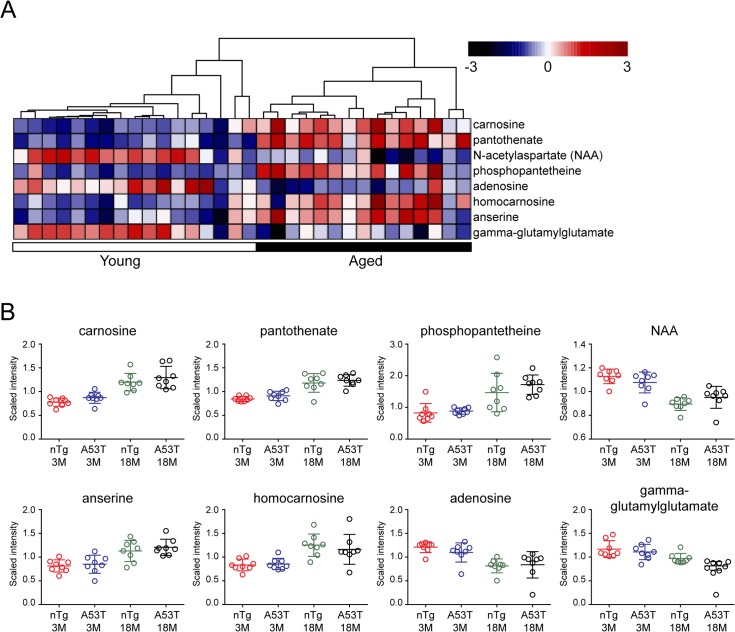
Fig 4. Identification of Aging-related metabolite biomarker.
(A) Two-way ANOVA test (q value <0.05) and RF analysis (Mean decrease accuracy >5) identify eight metabolites significantly affected by aging. Unsupervised hierarchical clustering plot shows the segregation between aged and young samples. The scaled intensity of eight metabolites is relatively depicted according to the color key shown on the top. Red indicates high intensity levels; blue, low intensity levels. The q-value used here represents the measurement of the proportion of false positives incurred (also called the false discovery rate). (B) Scatter plots compare the scaled intensity of those eight metabolites from different sample groups.

