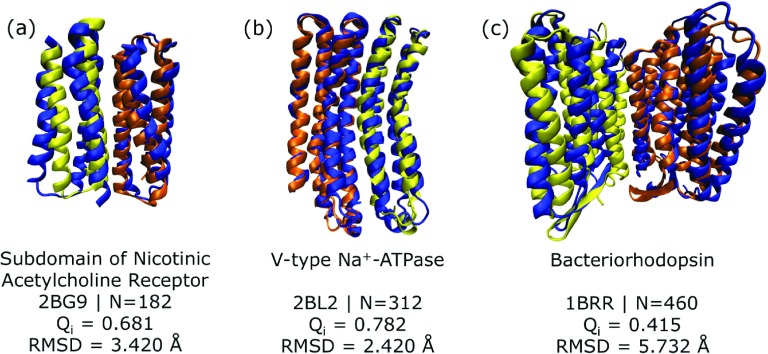
FIG. 1.
Structures with the highest final Qi values from ten simulated annealing runs using the AWSEM-membrane force field for (a) nicotinic acetylcholine receptor subdomain, (b) V-type Na+-ATPase, and (c) bacteriorhodopsin dimers. In all cases, one of the chains, chain A, is colored in yellow, and the other, chain B, is colored in orange, and the experimental structure of the complex, obtained from the Protein Data Bank,29 is colored in blue. The names of the proteins, their four-character unique identifier in the Protein Data Bank (PDB ID) and the number of residues are shown below each structure. The fraction of native interface contacts, Qi and the Cα RMSD of the complex compared with the experimental structure indicate the quality of the AWSEM-membrane predictions.

