
FIG. 2.
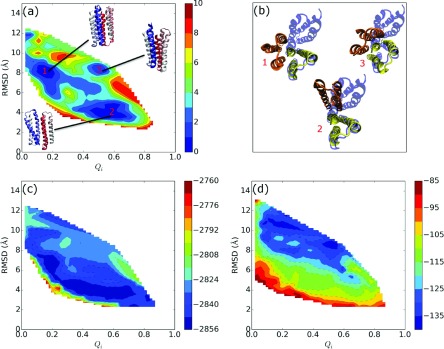
(a) Free energy profile of the nicotinic acetylcholine receptor subdomain (2BG9) dimer complex obtained using single memory AWSEM-membrane. The free energy is plotted versus Qi, the fraction of native interface contacts (x-axis) and the RMSD (y-axis). Representative structures are shown from the three free energy basins. (b) Top views of representative structures from each low free energy basin (chain A is colored in yellow, chain B is colored in orange), with the native structure (shown in transparent blue). Expectation values of (c) the total potential energy, PE, and (d) the contact energy, Econtact, are plotted versus the same order parameters.