
FIG. 4.
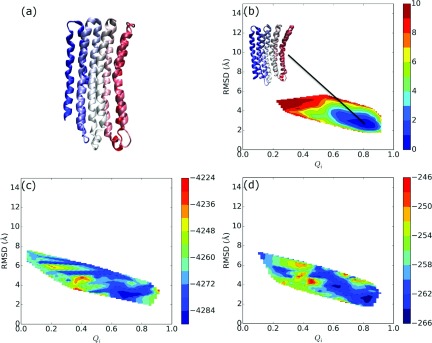
(a) Native configuration of the V-type Na+-ATPase (2BL2) dimer complex visualized using Visual Molecular Dynamics (VMD).30 (b) Free energy profile of the V-type Na+-ATPase (2BL2) dimer complex obtained using single memory AWSEM-membrane. The free energy is plotted versus Qi, the fraction of native interface contacts (x-axis) and the RMSD (y-axis). A representative structure from the free energy basin is shown. The expectation values of (c) the total potential energy, PE, and (d) the contact energy, Econtact, are plotted versus the same order parameters.