
FIG. 8.
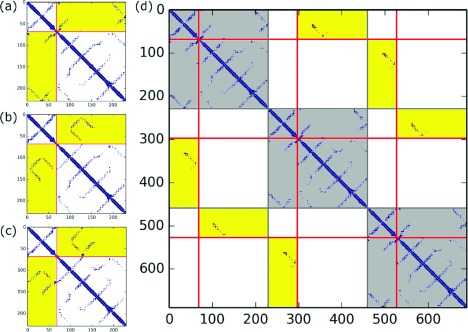
Contact maps of representative structures obtained from simulated annealing simulations of the cleaved bacteriorhodopsin monomer (contact maps (a), (b), and (c) correspond to structure (1), (2), and (3) in Figure 7, respectively) and the contact map of the bacteriorhodopsin trimer complex (d). Sections of the maps that show intra-monomer contacts are colored in gray. Sections of the maps that show inter-subunit contacts are colored in yellow, in which conserved contacts found in simulated annealing structures and the inter-subunit contacts in the trimer complex are colored in red. Red lines separate the C1 fragment and C2 fragment of the cleaved bacteriorhodopsin molecule.