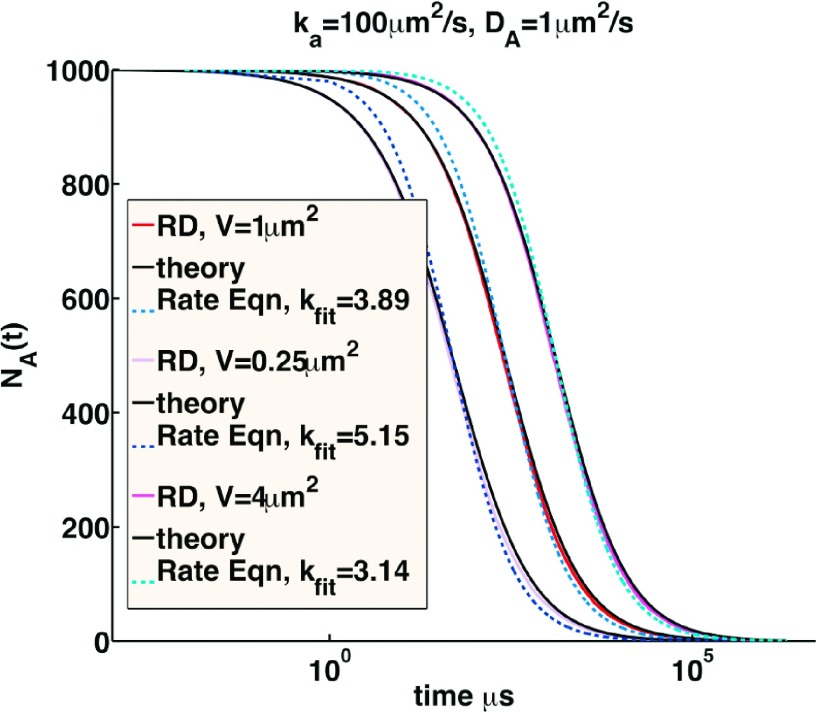
FIG. 3.
Rate-equation relaxation vs RD relaxation for A + A → 0 with fixed reaction parameters and varying initial conditions. All systems have ka = 100 μm2/s, Dtot = 2 μm2/s, σ = 1 nm, and NA = 1000 particles. Black curves are Smoluchowski prediction from Eq. (4). Solid purple, red, and magenta curves are numerical solutions using FPR, repeated for 50 trajectories, as V changes from 0.25 μm2, 1 μm2, and 4 μm2. Dashed lines are solutions that are best-fit to the rate equation using a fixed rate constant, where the best fit was defined such that A(t)/A0 = 0.5. The time-dependence deviates from the RD behavior, and the best-fit rate decreases as the volume increases.

