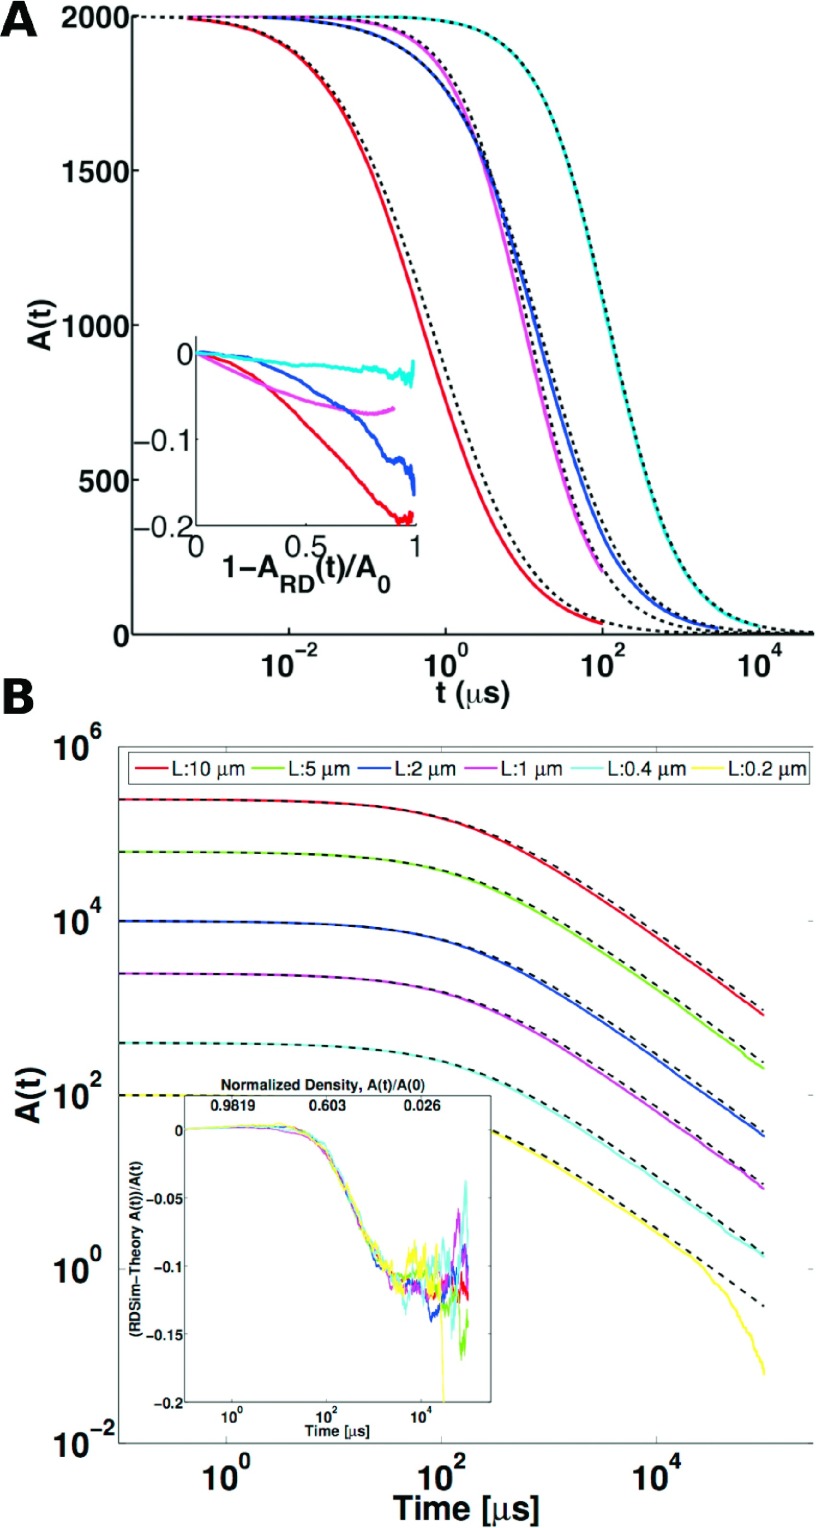
FIG. 4.
(a) Irreversible A + A → 0 reaction, RD simulations with FPR compared with Smoluchowski theory predictions for varying ka and volume (Eq. (4)). Red and magenta curves are FPR simulations at N/V = 0.1/nm2, Dtot = 2 nm2/μs, with ka = 100 and 1 nm2/μs, respectively. Blue and cyan curves are FPR simulations at lower density N/V = 0.01/nm2, again for ka = 100 and 1 nm2/μs. Time step used was 1 ns at V = 0.01, and 0.1 ns for V = 0.1. The inset shows the relative error of the Smoluchowski theory (ST) to the simulation [ARD(t) − AST(t)]/AST(t), as a function of the reaction going to completion (A(t) → 0). Each RD simulation was repeated over 100-1000 trajectories. Error of the theory decreases with lower density and ka. (b) Irreversible reaction A + A → 0 with changing box size for RD simulation vs Smoluchowski theory. The reaction parameters, DA = 0.5 nm2 μs−1, ka = 30 nm2 μs−1, and initial concentration of 2500 A particles per μm2 are the same in all systems. Averaged trajectories of A(t) shown for square box edge L = 10 μm (red), 5 μm (green), 2 μm (blue), 1 μm (magenta), 0.4 μm (cyan), and 0.2 μm (yellow), simulated with Δt = 0.1 μs. The black dashed lines are the Smoluchowski theoretical results from the solution of Eq. (4). Inset shows the normalized error between theoretical and simulation results as a function of time and normalized density. The systems are clearly big enough that no effect of box size in controlling the spatial range and long-time behavior of these systems is occurring.

