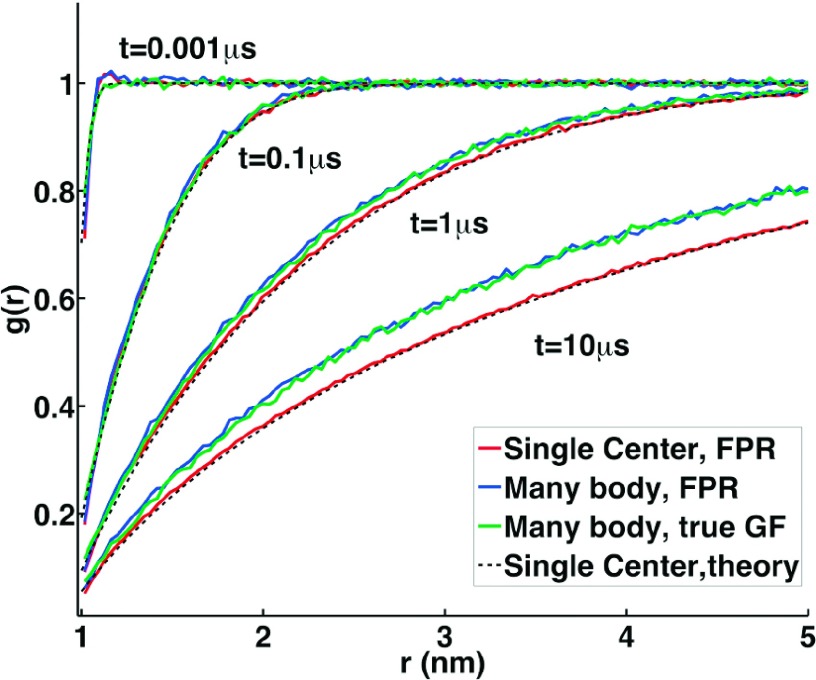
FIG. 5.
Comparison of the particle density, or radial distribution function, g(r), around each reactive particle calculated from theory and many-body simulation. Numerical simulations of the many-body A + A → 0 system are shown in blue (FPR simulations) and green curves, where green curve simulations sampled particle pair positions from simple BD updates but then rescaled to a separation defined by the true Green’s function. This comparison simply indicates the accuracy of the reweighting approach in reproducing the density of particles. The black dashed lines are the predictions of Smoluchowski theory assuming a single reactive center, and red curve is the same exact system as the theory defines, using the FPR approach for further validation of the simulations. N/V = 0.01/nm2, ka = 100 μm2/s, Dtot =2 μm2/s.

