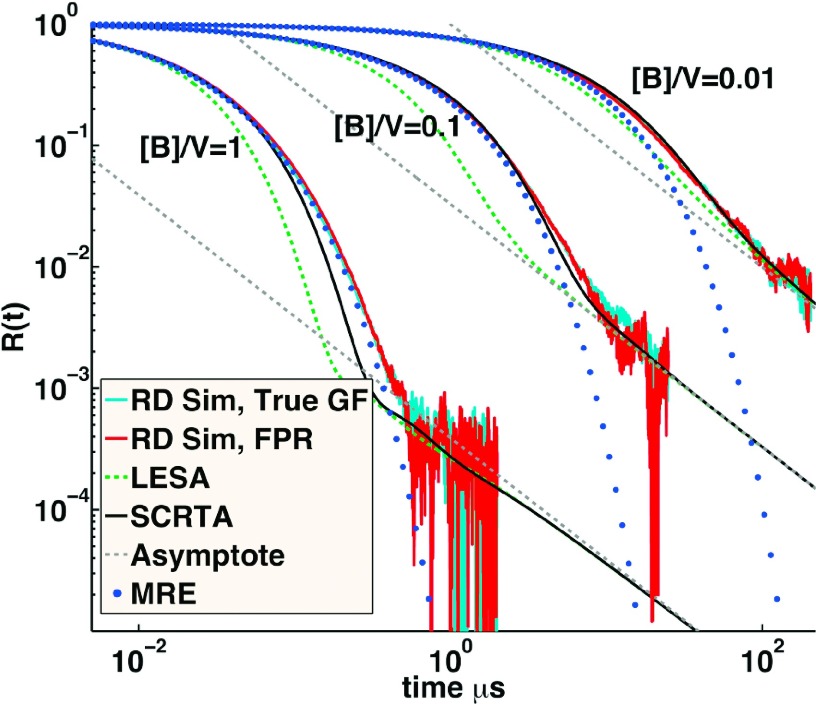
FIG. 7.
Relaxation of the pseudo-first order reversible reaction A + B⇆C with [B] ≫ [A] compared between numerical simulations and multiple theoretical predictions. R(t) = [A(t) − Aeq]/[A0 − Aeq]. Cyan curves are solutions using RD with the correct GF used to select radial separations after collisions. Red curves are solutions using the FPR algorithm. The long time asymptotic power-law behavior is shown in dashed gray, and the increasingly accurate approximations from LESA28 and SCRTA29 are shown in green and black dashed, respectively. The MRE solution is shown in blue dots, which uses Smoluchowski theory and therefore cannot reproduce the power-law approach to equilibrium. For all cases, ka = 100 μm2/s, kb = 106 s−1, DB = 2 μm2/s, and DA = 0, σ = 1 nm and V is in nm2.

