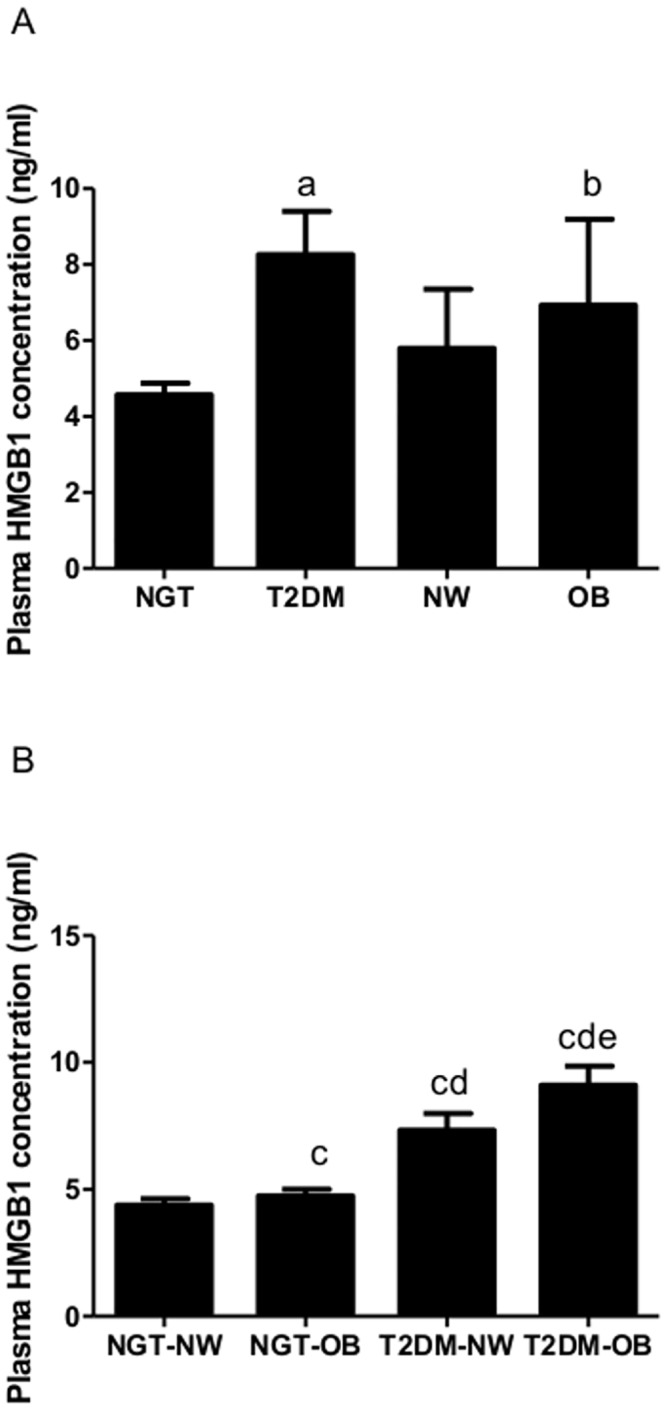
Fig 1. Plasma HMGB1 concentrations.

A. Comparison of HMGB1 concentrations in NGT, T2DM, NW and OB groups. B. Comparison of HMGB1 concentrations in NGT-NW, NGT-OB, T2DM-NW and T2DM-OB subgroups. aP < 0.001 compared with NGT. bP < 0.001 compared with NW. cP < 0.01 compared with NGT-NW. dP < 0.001 compared with NGT-OB. eP < 0.001 compared with T2DM-NW.
