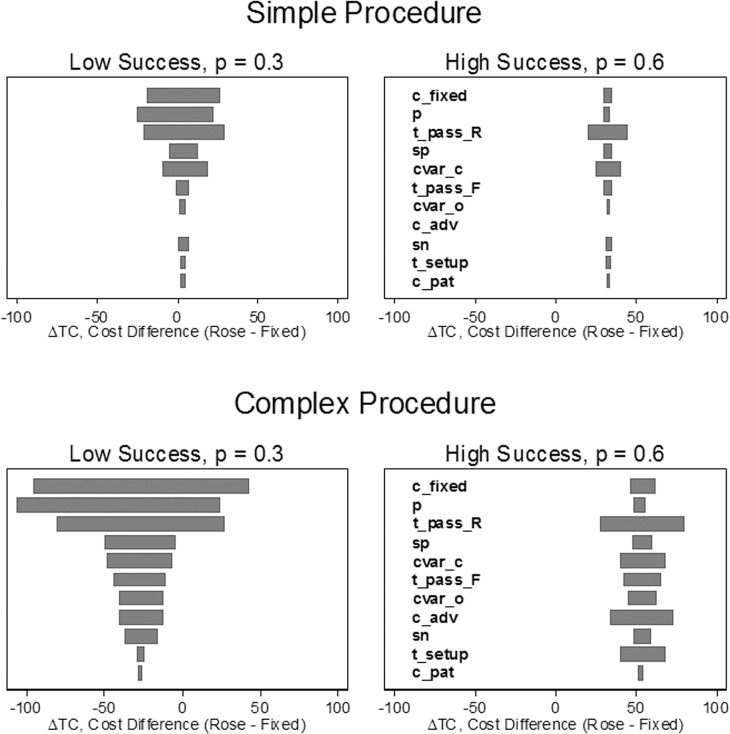
Fig 3. Probabilistic sensitivity analysis of cost difference of ROSE and fixed sampling by scenario.
The graph shows the distribution of the difference in expected cost (ROSE–fixed) for 32 different scenarios. Scenarios consist of a procedure type (simple or complex), a per-pass success rate (low or high) and stopping rules for sampling (fixed sampling stops after n F needle passes, ROSE stops after n R adequate samples are obtained). For each scenario, the input parameters were varied over the range shown in Table 2 using Monte Carlo simulation. Values less than zero favor ROSE. For example, ROSE is generally less costly than fixed sampling in the scenario in the upper left panel (simple procedure, low per-pass success rate, n R = 1, n F = 2).

