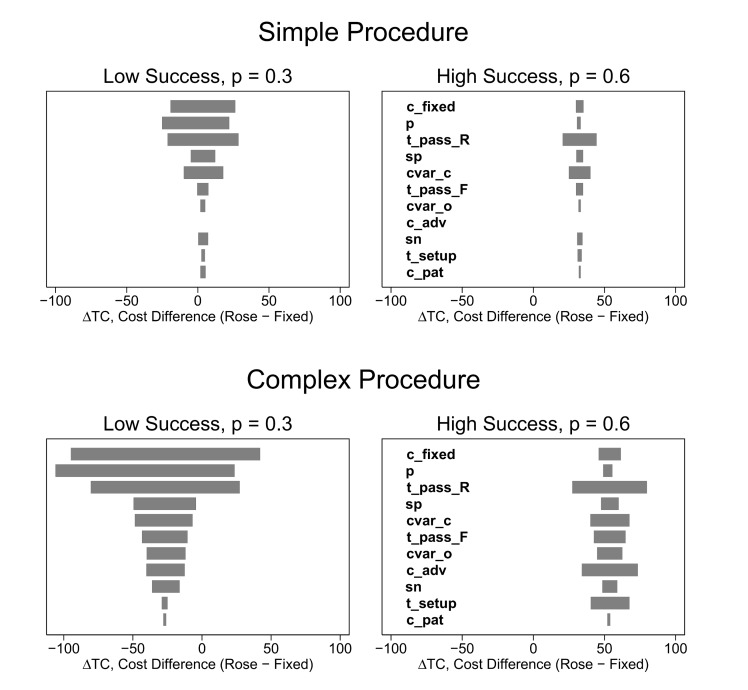
Fig 4. One-way sensitivity analysis.
Each input parameter was varied over its range (shown in Table 2) and the difference in total cost per case (ROSE–fixed) was calculated for each value of the input parameter. The total cost difference is given by Eq 14 in the text. Negative values indicate that ROSE is less costly. Each bar shows the range of the difference in total cost as a function of variation in a particular variable. For example, the top bar in each panel shows the sensitivity of the difference in total cost to variation in the fixed cost. Each panel shows the one-way sensitivity of a particular scenario to variation in the input parameters. Wide bars indicate the cost difference is relatively sensitive to variation in the parameter. Narrow bars indicate low sensitivity. Each scenario consists of a procedure type (simple or complex), a per-pass success rate (low or high) and a set of stopping rules. Each scenario used the same set of stopping rules (three needle passes for fixed sampling, ROSE stops after observing the first adequate sample). Please refer to the Glossary (S2 Text) or the text for definitions of procedure types, and scenarios. Variables are defined in Appendix (S1 Text) and in the text.

